Begin Your Trip to Observability by Packing Your Baggage With Context

When you take a trip, do you put a luggage tag on your bags when you travel? Have you thought about doing the same thing with your microservice transactions? Adding contact information to your luggage seems to be pretty normal. The addition of an external identifier allows an airline to quickly get a hold of you if your luggage gets lost. The time to get in contact with you may even be reduced without the need to login to a computer system to find it. Baggage information for a microservice transaction can let developers know the same sort of information about external systems to quickly identify the root cause of problems.
When you pack for a trip you put things in your baggage that you need for the trip, close the bag and head to the airport or train station. If you are checking your luggage, you may need to fill out a tag with your name, address, phone number and email address.In addition the airline will provide a tag with a barcode on it. This barcode tells the airport where your bags are going, what plane to put the bag on and so on. The luggage tracking number allows the airline to track a bag from its origin, its transfers and finally to its destination. In the scenario of an airline's luggage tracking number it could be used in a similar way to an OpenTelemetry TraceId; with each stop along the way a span in the trip. The luggage tag attached to your bag with your contact information could be seen as OpenTelemetry baggage.
To better understand the health of an individual service or a complete view of a transaction, developers rely on telemetry. Telemetry, being the collection and analysis of data points over time commonly made up of metrics, traces, and logs. OpenTelemetry is a vendor neutral solution, offering standardized data models for telemetry. In this article we are going to explore how OpenTelemetry baggage can help you add context to your metrics, traces, and logs. OTel baggage can enable us to follow our business processes through a transaction. This helps those interacting with it to know who it belongs to or what it is related to. This telemetry data can help developers troubleshoot and debug as well as tune systems to be more efficient. Adding a bit of additional information can drastically improve the time to determine the root cause of an issue.
Essentially, Log data is a textual record containing information about application, business service or some other activities. The OpenTelemetry Log Data Model specifies attributes such as: timestamp, severity level, log messages and optional attributes like baggage. This structure allows for easier parsing and analysis of logs, especially when combined with metrics. Metrics, on the other hand, represent measurable values and specific points in time. The OpenTelemetry metrics data model supports various types of data including numeric values. Metrics can be used for response times, or memory usage, and even string data for application, versions or commit numbers. This flexibility ensures comprehensive monitoring of an application's behavior, and can help build a better observable system.
Make Telemetry Personal with Context
Not being able to quickly identify an issue or filter to a specific identifier from an external system can lead to a frustrating experience while troubleshooting an issue. Modern applications are often distributed across many microservices and could be hosted in hybrid environments or solely in the cloud. Each of these services provides a unit of work and in doing so can generate vast quantities of data. The volume of raw data can make it hard to understand systems, health and performance.

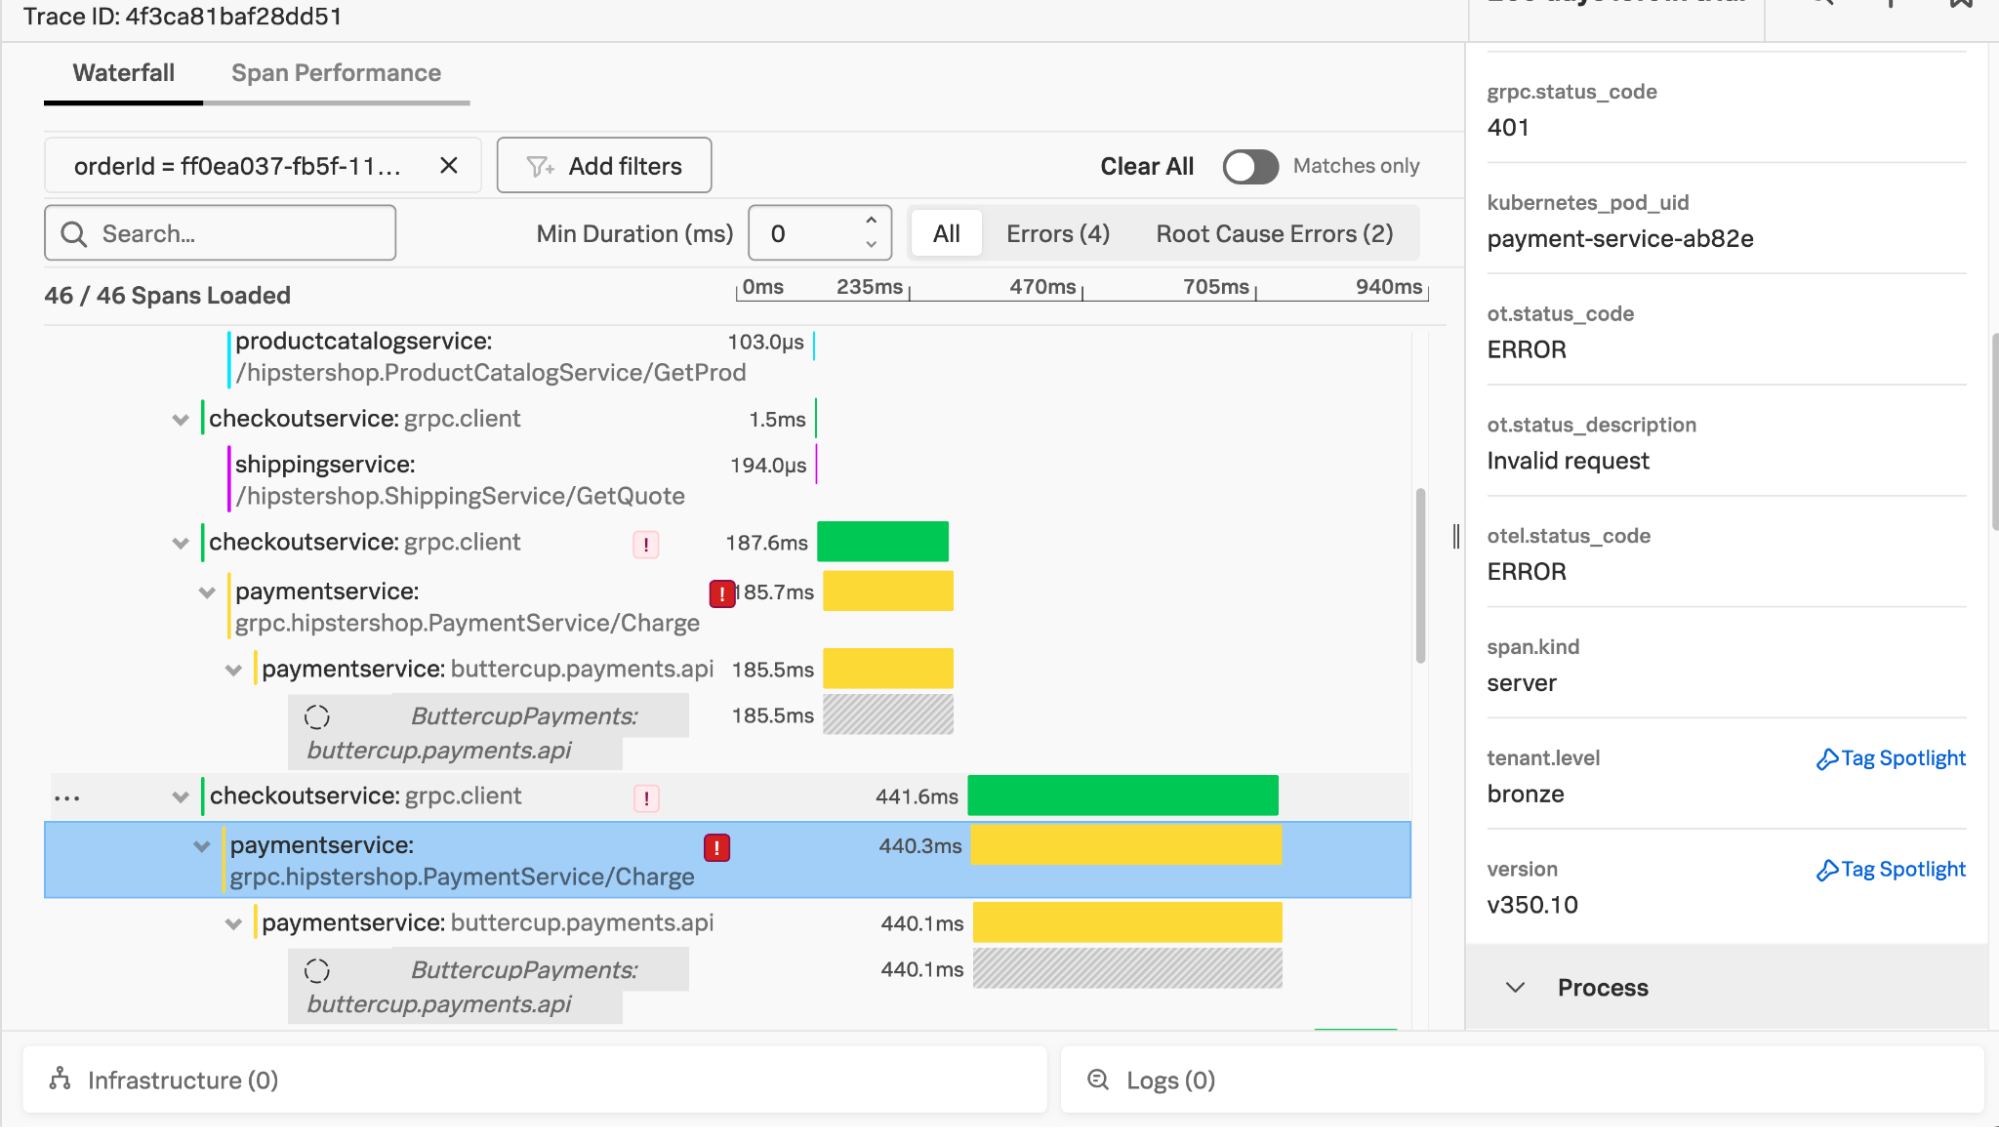
Figure 1-1. This displays an image of a trace filtered by orderId highlighting an error to the payment service in the Splunk Observability Cloud user interface.
Correlate Data Between Internal and External Services
One of the great things about OpenTelemetry is its ability to correlate data from multiple systems, protocols, and file formats allowing one to transform, normalize and integrate this data in one place. To enable propagation between services, OpenTelemetry utilizes baggage, which is a mechanism for propagating key value pairs across service boundaries. This allows you to add additional information which propagates with your request. The additional information adds quick value by enabling filtering in an APM vendor’s user interface. A simple change can possibly lead to a better on-call experience for a developer. This could allow one to do things such as identifying consumer friction, potentially before a customer reaches out to support.
Imagine a user request is flowing from their device, through a CDN to a cloud provider, followed by a chain of microservices. Telemetry can be propagated with relevant baggage information with a request. This could be a request through a shipping service, inventory service or shipping vendor. As the transaction passes through the services it passes existing trace context and baggage. The services can also do things such as adding an external tracking number from a vendor’s API response which will propagate with the request as baggage. The additional information in the baggage should be useful contextual information such as an external transaction ID, specific request identifier, risk score, commit hash or anything really. The baggage propagates along with the request, allowing logs, traces, and metrics to be generated. It enables you to go through the flow to be associated with the same user, request or other identifier useful to you and your situation. You could use baggage to determine where a user entered the network and which region they were routed. This additional baggage information can be useful for many applications such as disaster recovery exercises, regional routing validation or determining a user's point of presence.
Observe What Is Interesting to Your Organization
Utilizing baggage, developers can achieve a holistic view of their application behavior. If thoughtfully instrumented, baggage can provide insight into higher level business services. It can also allow developers to include key information to quickly provide valuable insights. This can be for troubleshooting, marketing purposes or for even determining if old versions of an application are running in production. Any business can experience problems and when this happens a developer may end up getting a phone call while working an on-call shift over the weekend.

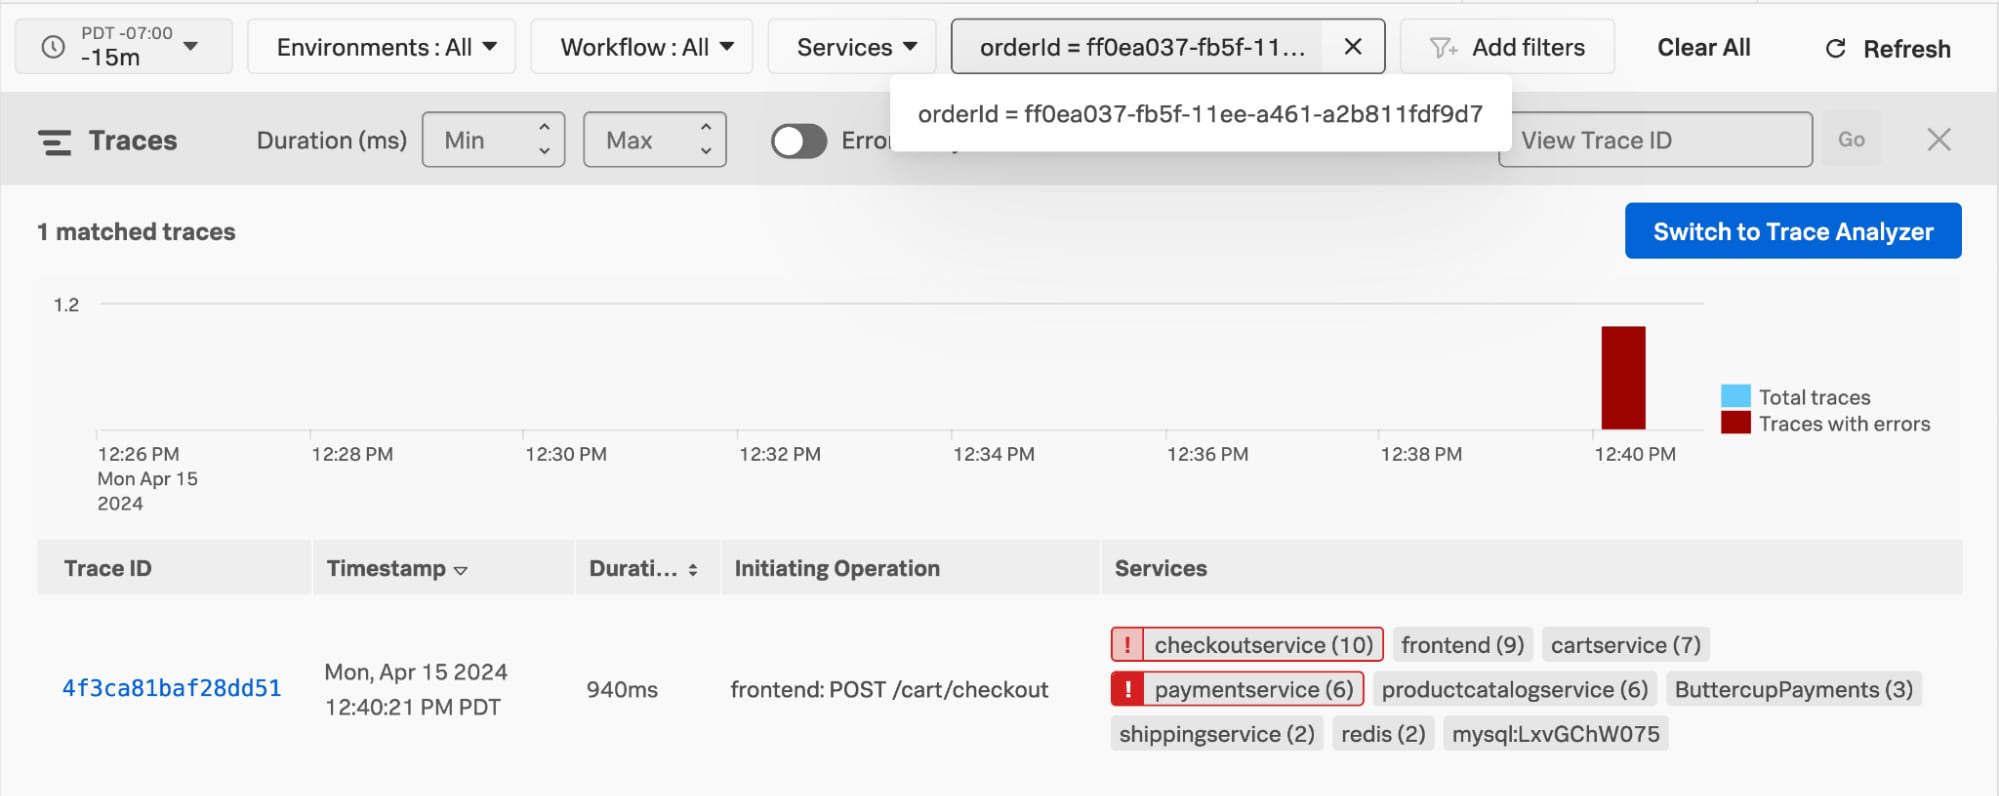
Figure 1-2. This displays an image of a trace filtered by orderId in the Splunk Observability Cloud user interface.
Imagine a developer getting paged after customer complaints (or hopefully after receiving a service alert). They might get a vague message about user experience being bad for a particular service such as a slow checkout process. At this point troubleshooting by a developer begins. As a first step, they can look in their application performance management tools to find services with errors or high latency as exposed through their traces. Then after identifying a potential issue they can move on to application dashboards of relevant services. After finding an issue they may need to find the root cause of a problem, or check your APM tool used to help correlate this baggage to the other requests within the traced transaction.
- Context Propagation: Baggage allows you to propagate key-value pairs along with traces, metrics and logs using context propagation. This critical context, such as a user ID, session ID, or the debugging flags, helps to enrich your telemetry data, which makes it easier to understand the flow of a request just across numerous microservices.
- Debugging: OpenTelemetry Baggage provides valuable information for debugging purposes. By examining the baggage associated with a trace, you can understand the context surrounding a specific request, which can lead to quickly pinpointing potential problems. This can lead to reducing Mean Time to Detect and Mean Time to Resolve/Repair, leading to increased value.
- Language Agnostic: OpenTelemetry is language neutral and support differs between languages. Baggage key value pairs can be included within a trace from any programming language supported by OpenTelemetry, ensuring consistent context propagation across your entire application or business services.
- Filtering and Analysis: OpenTelemetry baggage propagates as key value pairs, it becomes easier to filter in analyzed trace data based on specific criteria. This context can be helpful for identifying issues related to a particular user session or functionalities within a business service or unit.
- Future proof and vendor neutral: OpenTelemetry is a constantly evolving project with contributions from individuals and corporations, such as Splunk. Splunk natively supports OpenTelemetry and you can expect ongoing improvements in support for future functionality.
Identify Key Information To Drive Value for Your Services
Identifiers are everywhere, they may be used on your luggage from check-in to luggage claim, enabling automated sorting by baggage handlers. That information alone isn't enough to find you if the bag tag gets lost or damaged. This is why adding an additional luggage tag with your contact information is generally good practice. OpenTelemetry baggage is like adding your contact information to each trace, log and metric. This can help you troubleshoot if you're a developer by enabling filtering on things that matter to them. It can also unlock the calculation of additional metrics derived from the addition of baggage to the trace context. If you are taking a trip, think about adding a luggage tag with your contact information. If you are thinking of tracking a bug or error in a complex business system, you might want to think about adding baggage with key information you value.
Next Steps
If you're looking to quickly get started with OpenTelemetry, give Splunk's OpenTelemetry Zero Configuration a try. The process can be as easy as three simple steps. First connect your cloud environment, deploy the Splunk distribution of the OpenTelemetry collector in your environment and then run your application. As you proceed further in your Observability journey, add some baggage it will make matching, analyzing, filtering and just observing a bit easier.
Related Articles
About Splunk
The world’s leading organizations rely on Splunk, a Cisco company, to continuously strengthen digital resilience with our unified security and observability platform, powered by industry-leading AI.
Our customers trust Splunk’s award-winning security and observability solutions to secure and improve the reliability of their complex digital environments, at any scale.


