Adding RUM to Your ITSI Cocktail: Content Pack for Splunk Observability V2

Want to improve your outlook with a splash of RUM? In our pursuit of connecting users to the right data at the right time, we’ve come to see Real User Monitoring as an invaluable tool for understanding the total picture when it comes to your web properties, apps, and cloud footprint.
Do you find yourself asking any of these questions?
- I wonder how different versions of our mobile apps are performing?
- Are our Android or our iOS apps crashing more frequently?
- Is our content throwing errors or experiencing increased latency on certain browsers more than others?
- Do we need to spend resources on improving our Google Web Vitals scores?
Splunk Real User Monitoring (RUM) can help you with these questions and more! And now, with the inclusion of RUM and RUM mobile in the Content Pack for Splunk Observability v2, your organization can start leveraging that Real User data with other data sources already in your ITSI environment. This content pack includes everything from high-level Executive Glass Tables for quick summaries, to quick navigation out of ITSI (and ITE Work) into Splunk Observability for further investigation of realtime RUM, APM, and Infrastructure metrics.
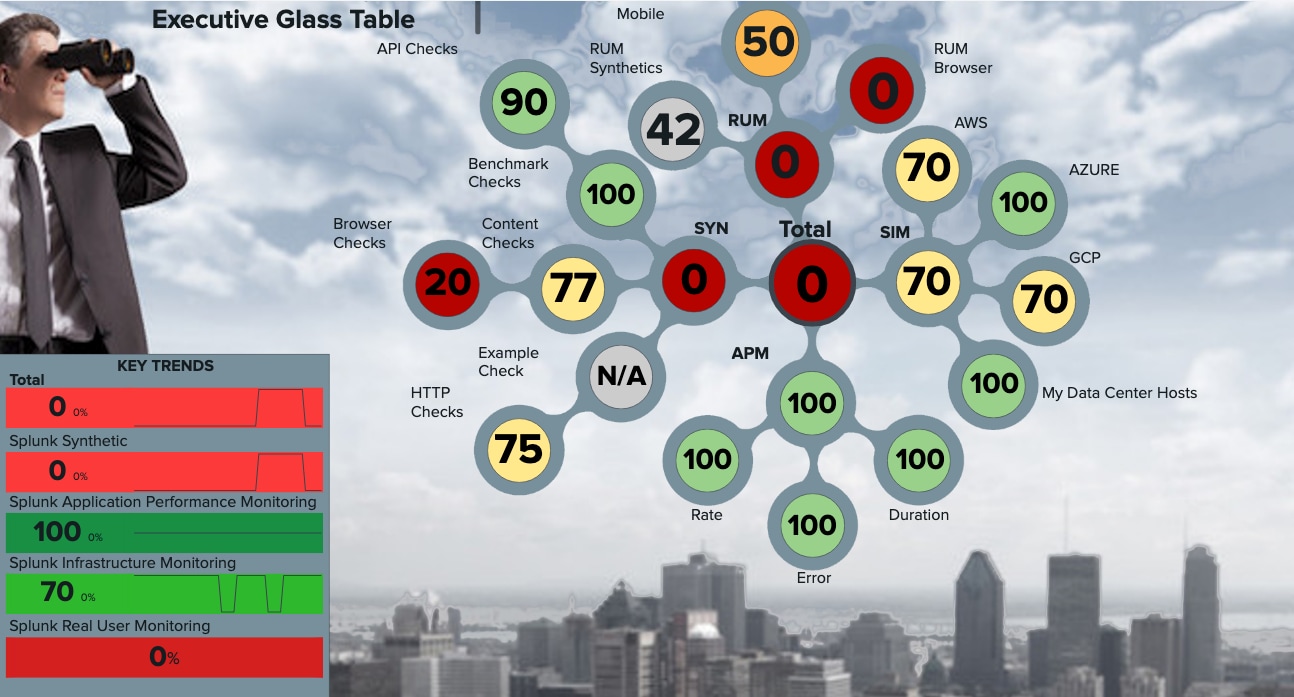
 Figure 1-1. Observability Content Pack v2: Executive Glass Table (now with RUM)
This content pack update provides:
- New Service Analyzer sections for RUM
- 3 new Services for RUM/RUM Mobile/RUM Synthetics
- 12 new RUM specific KPIs (including easy to change thresholds)
- 3 new RUM Dashboards
- 2 new Glass Tables and 4 updated Glass Tables
These new features combined with additional navigation suggestions for quickly moving from Splunk IT Service Intelligence (ITSI) to Splunk Observability provides useful views for IT Operations, Business & IT Executives, DevOps, and Software Engineers.
The best news? The Content Pack for Splunk Observability is now available in the Splunk App for Content Packs for both ITE Work and ITSI!
Updates in the Content Pack for Splunk Observability v2
If you’re familiar with ITSI you’ve likely used Glass Tables to provide quick insights across your Services, KPI’s, and associated ITSI Entities. In version 2 of this Content Pack we’ve not only added RUM data to the mix, but have also provided ITSI components specifically designed to better understand Real User concerns. Various IT professionals in your organization will be able to leverage this data in various ways. Some examples include:
- IT Operations: Quickly determine if an outage or incident is related to a given mobile app, app version, or browser. Seeing a wave of errors coming from that new version of your iOS app? No sweat! With RUM KPIs and Entities in ITSI, IT Ops analysts can quickly dive into issues facing real users in the wild.
- CIO / CTO: For executives, time is money. With this Content Pack’s Glass Tables, executives can get an accelerated understanding of the health of their cloud infrastructure, and now with RUM, get quick stats on mobile and web properties.
- Business Leader: Business Leaders concerned with the impact of software, infrastructure, and app changes, can leverage ITSI’s Service Analyzer for a more detailed view of Real User experiences along with extensive cloud metrics. Easy to navigate Service Analyzer tree views quickly lead from high level information to individual entities.
- DevOps / DevSecOps / SRE: Dev(Sec)Ops and SRE practitioners live in the data and their decisions are molded by it. Using the right tool for the job means being able to quickly jump between Splunk and Splunk Observability. With the addition of Real User Monitoring data, another datasource is added to the developer’s quiver for understanding current issues impacting real users. This data can be crucial in telling user stories that drive performance improvements and feature updates within your organization.
We’ll highlight some of the specific additions to the Content Pack for Splunk Observability’s offerings below:
Glass Table: Executive Glass Table
The Executive Glass Table delivers rolled-up insights across 4 major observability areas: Synthetic Monitoring, Infrastructure Monitoring, Real User Monitoring, and Application Performance Monitoring. We’ve sung the praises of these sorts of Glass Tables in our initial release of the Content Pack for Splunk Observability.
“In a single view, you get a quick and real-time update as to what is going on across all of your landscape, providing single-click access to additional details.
This answers the question of what is going on, why it’s happening and provides a deep-link (in context) to the source system in the Splunk Observability Cloud. This dramatically improves MTTI / MTTD / MTTR by simplifying the process of getting to the ‘needle in the haystack’ and resolving the root cause issue quickly.” - We're Making Observability Available in Splunk Enterprise!
Updates to our Executive-level Glass Table provide new insights from Real User Monitoring data streaming out of Splunk Observability. This includes handy KPI Threshold values for visualizing the health of Real User experiences at a glance. Along with Infrastructure metrics, Synthetics testing, and APM tracing data, this Glass Table provides a 40,000 foot view of cloud and web property health.
 Figure 1-2. Observability: RUM Executive Glass Table
Glass Table: RUM Overview [Columns]
The RUM Overview Glass Table brings your entire Real User Monitoring landscape together in one window.
On the right, you can quickly see the overall health of Real User sessions in apps, native browsers, and even synthetic user tests. To the left of this overview are more detailed breakdowns of KPIs specific to browsers, apps, and synthetic tests. Each KPI is colored in relation to incoming metrics and easily adjustable thresholds. Click deeper into specific KPIs, and ITSI will help you navigate through your ITSI entities and onward into Splunk Observability’s RUM dashboards.
 Figure 1-3. RUM Observability Overview [Columns]
Glass Table: NOC Glass Table [Layered]
In the NOC, signals and metrics must be sorted out quickly and information passed on to the correct teams to fix an issue. Speed is of the essence and the possibilities for where to start troubleshooting can feel endless.
In an attempt to give a further leg up to our friends in the NOC we’ve updated their Glass Table to include RUM metrics. These additional signals can help more quickly diagnose wider issues. For example, a change that is deployed and begins to impact native browsers, but not apps, will become readily apparent from the change in browser KPIs. Drilling down into which KPIs are having issues can then further determine its cause. This increased fluency from data to doing, enables IT Operations in the NOC to more quickly notify the correct teams, who can then rapidly get a fix into production.
 Figure 1-4. Observability: NOC Glass Table [Layered]
Glass Table: DevOps SRE Detailed View
Updates to the Glass Table for DevOps and SRE functions now include RUM KPIs. These details can help tell the data stories DevOps and SRE need to prioritize bug fixes, identify what to monitor, and help determine if newly deployed code changes are impacting the overall customer experience.
Additionally, using the clickthrough links to the underlying data will help them establish why an issue happened, and what can be done in the future to avoid a similar incident.
 Figure 1-5. Observability: DevOps SRE Detailed View
For more information about glass tables, see Overview of the glass table editor in ITSI and a video Getting started with Splunk ITSI Glass Tables.
Service Analyzer & Services
As the “home page” of Splunk IT Service Intelligence (ITSI), the Service Analyzer in the Content Pack for Splunk Observability acts as a map to discovering your entire cloud architecture. Simply click within the Service Analyzer to view KPIs specific to a given Service. We’ve updated the Service Analyzer to include detailed RUM Services, KPIs, and Entities to help you navigate from the high-level view, through entity level KPIs, and even directs you into detailed data within the Splunk Observability UI. KPIs are split up by Browser, App, and Synthetic tests to help put your eyes where they are most needed.
 Figure 1-6. Observability: Service Analyzer - Tree View
KPIs & Entities
Key Performance Indicators (KPIs) for RUM in ITSI pull from Splunk Observability Cloud RUM metrics to power ITSI’s Service Analyzer (along with the ITE Work Infrastructure Overview) and enrich your ITSI entities. To complement these KPIs, easily modifiable thresholds have been included to help track the health of your organization’s RUM Entities. Everything from browser interactions in Chrome or Safari to app interactions on various devices and app versions are available.
Additionally, KPIs for Google Web Vitals Scores will help you understand how Google users and Google rankings are being influenced by interactions with web properties.
The Content Pack for Splunk Observability Cloud provides over 80+ KPIs, and each of these KPIs link you through ITSI entities to specific dashboards and onward through navigation suggestions to the Splunk Observability Cloud UI.
 Figure 1-7. RUM Service Analyzer, KPI’s, and Entities (in this case for Chrome users on Linux)
With these new additions to the Content Pack for Splunk Observability, we are providing a more fluent bridge between Splunk ITSI and Splunk Observability to help you with visibility into your cloud native workloads. Out of the box features like navigation suggestions, entities, KPIs, services, and the updated Service Analyzer will bring immediate value to your customer experience. For the Splunk or ITSI experts and aficionados, these services/service templates, KPIs, KPI base searches, and entities can be leveraged as templates for enriching their business logic that already exists in Splunk and ITSI with Splunk Observability metrics.
Next Steps
If you’ve previously used the Content Pack for Splunk Observability we expect this addition to provide you with even more of what you already love. Go grab the latest version in the Splunk App for Content Packs!
If you’re new to Splunk Observability and want to start getting some of those insights into your ITSI environment see our docs for help: Installing and configuring the Content Pack for Splunk Observability Cloud from the Splunk App for Content Packs!
Not yet a Splunk Observability user? Sign up for a free trial!
This blog post was authored by Jeremy Hicks at Splunk with special help from: Todd DeCapua, Adam Schalock, Joel Schoenberg, and Jenny Hollfelder
Related Articles
About Splunk
The world’s leading organizations rely on Splunk, a Cisco company, to continuously strengthen digital resilience with our unified security and observability platform, powered by industry-leading AI.
Our customers trust Splunk’s award-winning security and observability solutions to secure and improve the reliability of their complex digital environments, at any scale.


