Unlocking Efficiency: How the Splunk AI Assistant for SPL Transforms the IT Analyst Role

 Ever felt like you're juggling too much in your IT role, from urgent tasks to upskilling your team? Well, buckle up, because we're about to walk you through a game-changer: the Splunk AI Assistant for SPL. This nifty tool is designed to ease the load for Splunk admins, operations and security analysts, and IT managers. Our focus today? The life of an IT Analyst, who is relatively new to Splunk, and can now utilize the Splunk AI Assistant for SPL to make their day-to-day not just bearable, but actually pretty darn efficient.
In this blog, we'll cover the three main usages of the Splunk AI Assistant for SPL: Writing SPL Queries, Explaining SPL Queries, & answering users questions based on Splunk Docs. Let's get the ball rolling and see how Splunk AI Assistant for SPL turns these daunting tasks into a walk in the park.
Query Writing Simplified
Imagine our IT Analyst is up against a tight deadline. They're tasked with generating a report to identify free space on Windows hosts—a task that traditionally requires a significant amount of manual search and parameter adjustments. This is where the Splunk AI Assistant for SPL shines.
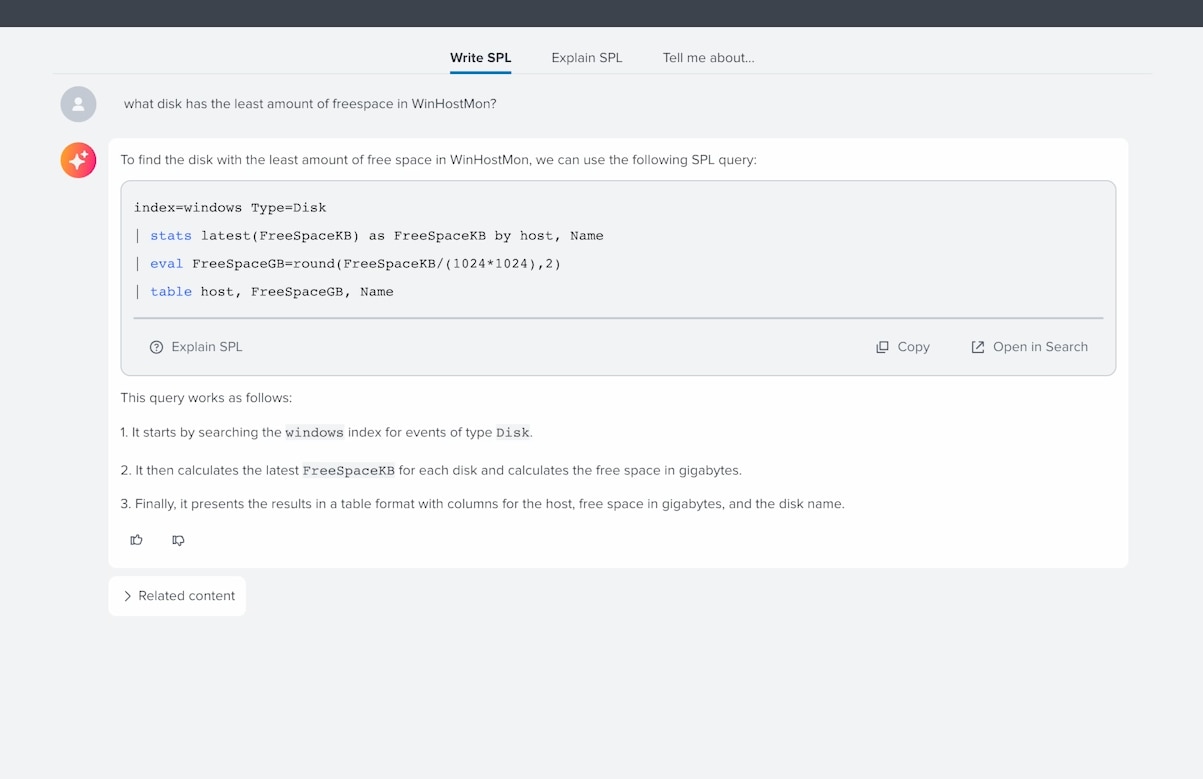
Instead of diving headfirst into complex searches, our analyst simply asks the Splunk AI Assistant for SPL, "What disk has the least amount of free space in WinHostMon?" And boom, the Assistant generates a complete SPL query:
index=windows Type=Disk | stats latest(FreeSpaceKB) as FreeSpaceKB by host, Name | eval FreeSpaceGB=round(FreeSpaceKB/(1024*1024),2) | table host, FreeSpaceGB, Name
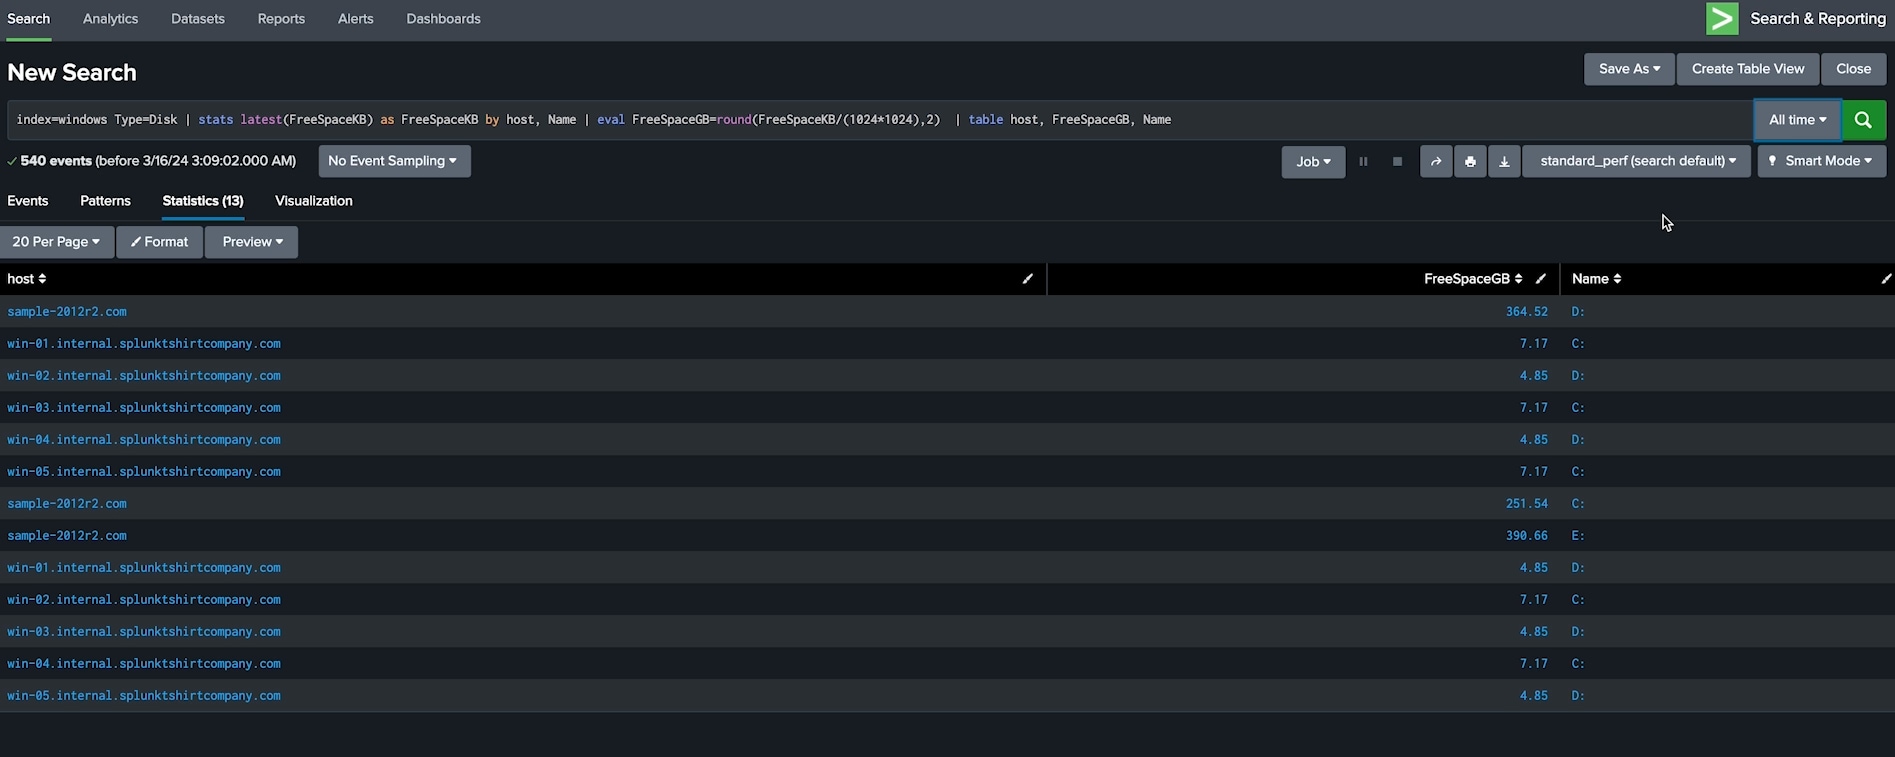
This SPL query is not just a bunch of code; it's a well-thought-out command that checks for free space across Windows hosts, converting kilobytes to gigabytes for easier understanding. The "Open in Search" button is a neat feature that launches this query in a new tab, displaying the results in a user-friendly table format. Our analyst can now easily visualize data, make informed decisions, and share insights with the team, all thanks to the Splunk AI Assistant for SPL's intuitiveness.
Deciphering Complex Queries
Next up, our analyst faces another challenge: understanding the underlying search of complicated search. Today we will look at an Active Directory dashboard implemented from the Splunk IT Essentials Learn App. Traditionally, this would involve a painstaking process of deconstructing the SPL query line by line or seeking help from a Splunk expert.
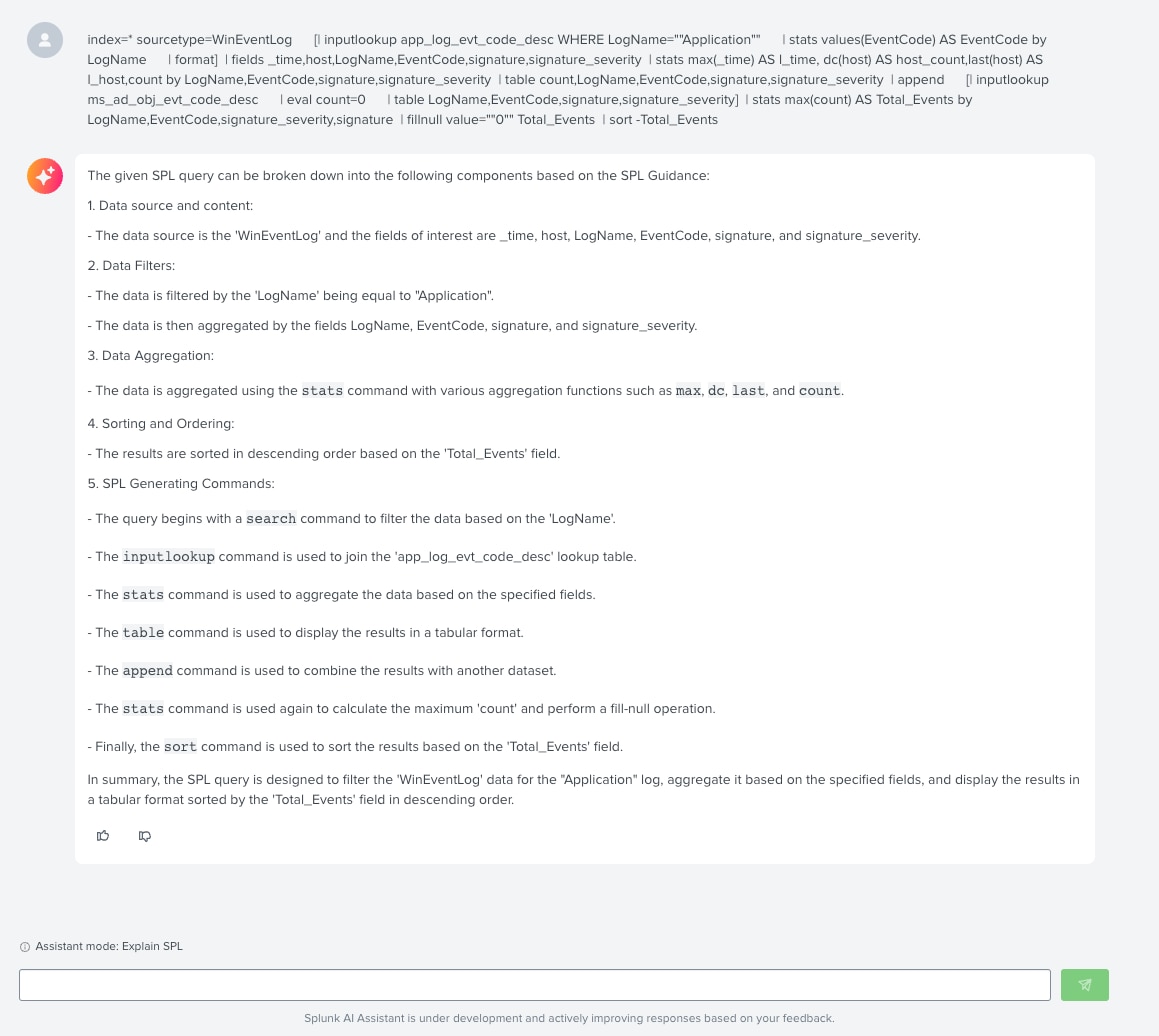
Fortunately, the Splunk AI Assistant for SPL is here to save the day again. With its capability to explain complex SPL queries in natural language, our analyst gets a quick, detailed explanation of the entire query, along with a concise summary. This particular SPL query involves various commands and functions designed to filter, aggregate, and sort data from the 'WinEventLog', focusing on the "Application" log, and presenting it in a clear, tabulated format sorted by 'Total_Events'.
index=* sourcetype=WinEventLog
    [| inputlookup app_log_evt_code_desc WHERE LogName=""Application""
    | stats values(EventCode) AS EventCode by LogName
    | format]
| fields _time,host,LogName,EventCode,signature,signature_severity
| stats max(_time) AS l_time, dc(host) AS host_count,last(host) AS l_host,count by LogName,EventCode,signature,signature_severity
| table count,LogName,EventCode,signature,signature_severity
| append
    [| inputlookup ms_ad_obj_evt_code_desc
    | eval count=0
    | table LogName,EventCode,signature,signature_severity]
| stats max(count) AS Total_Events by LogName,EventCode,signature_severity,signature
| fillnull value=""0"" Total_Events
| sort -Total_Events
Summarizing Documentation
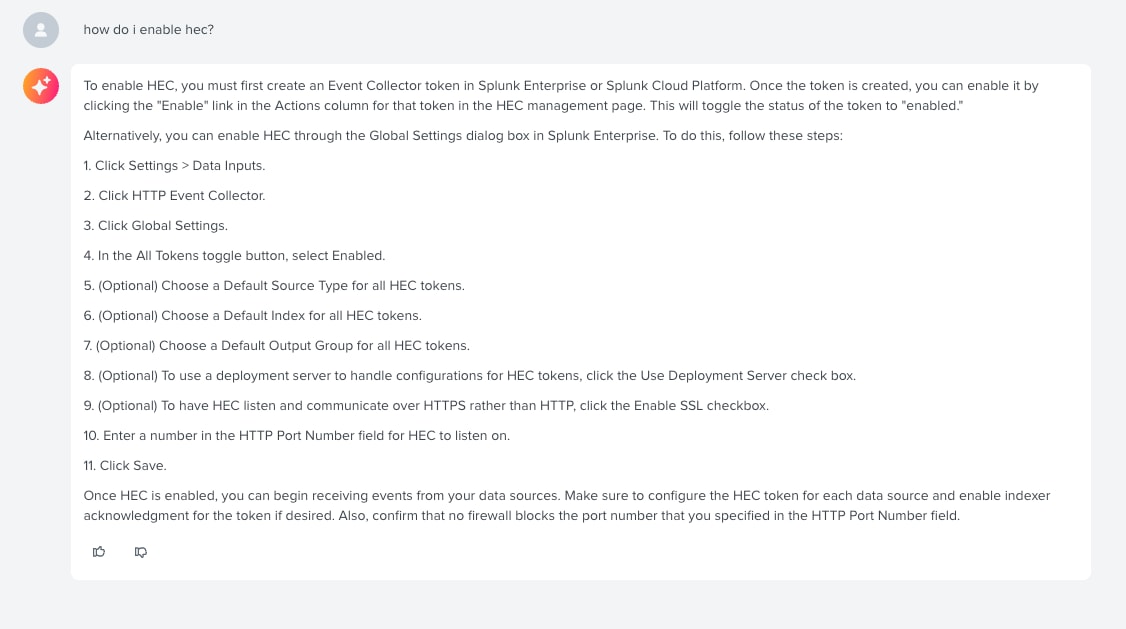
In the realm of IT, being able to swiftly troubleshoot mission-critical applications and infrastructure is not just an advantage; it's a necessity for developing a top-tier observability practice. The catch? You can't fix what you can't see. Achieving comprehensive visibility across all environments is foundational to effective troubleshooting. This is where the power of Splunk's HTTP Event Collector (HEC) comes into play, offering a direct pipeline for streaming data into Splunk. But how do you get started?
Gone are the days of aimlessly searching through Google or trudging through documentation. With the Splunk AI Assistant for SPL, IT analysts now have a direct line to the knowledge they need. A few clicks within the Splunk AI Assistant for SPL, you’ll be able to quickly ask, "How do I enable HEC?" and receiving immediate, actionable answers. Soon you will have a quick, step-by-step guide on enabling HEC, tailor-made for both reviewing change tickets and crafting internal documentation. This feature is an asset for IT analysts looking to streamline processes, educate new Splunk users efficiently, and enhance overall operational agility.
The Power of Splunk AI Assistant for SPL
Through these scenarios, it's evident that the Splunk AI Assistant for SPL is not just a tool; it's a revolution in how IT professionals approach their tasks. By simplifying complex queries, providing easy access to data insights, and enabling a deeper understanding of Splunk products, the AI Assistant empowers users to work more efficiently and effectively.
For those looking to dive deeper into the capabilities of the Splunk AI Assistant for SPL and explore more of its features, please reach out to your local Splunk team to demo the product or install it in your Splunk Cloud environment! If you're not with us in Las Vegas at .conf24, you can watch all the exciting news of the week at Splunk’s .conf24 Global Broadcast.
Follow all the conversations coming out of #splunkconf24!
Related Articles
About Splunk
The world’s leading organizations rely on Splunk, a Cisco company, to continuously strengthen digital resilience with our unified security and observability platform, powered by industry-leading AI.
Our customers trust Splunk’s award-winning security and observability solutions to secure and improve the reliability of their complex digital environments, at any scale.


