New Splunk Innovations Help Build a Leading Observability Practice for the Whole Enterprise

 So much goodness is coming your way! Find out all about the latest and greatest from Splunk Observability that helps you keep your entire stack up and running, no matter where it’s deployed or who’s troubleshooting.
See Everything, Everywhere, All at Once
When you’re faced with an outage, there’s no time to jump through different tools and click around endlessly to figure out what is causing the problem. You need to easily find all the information in one place. Splunk can help with that.
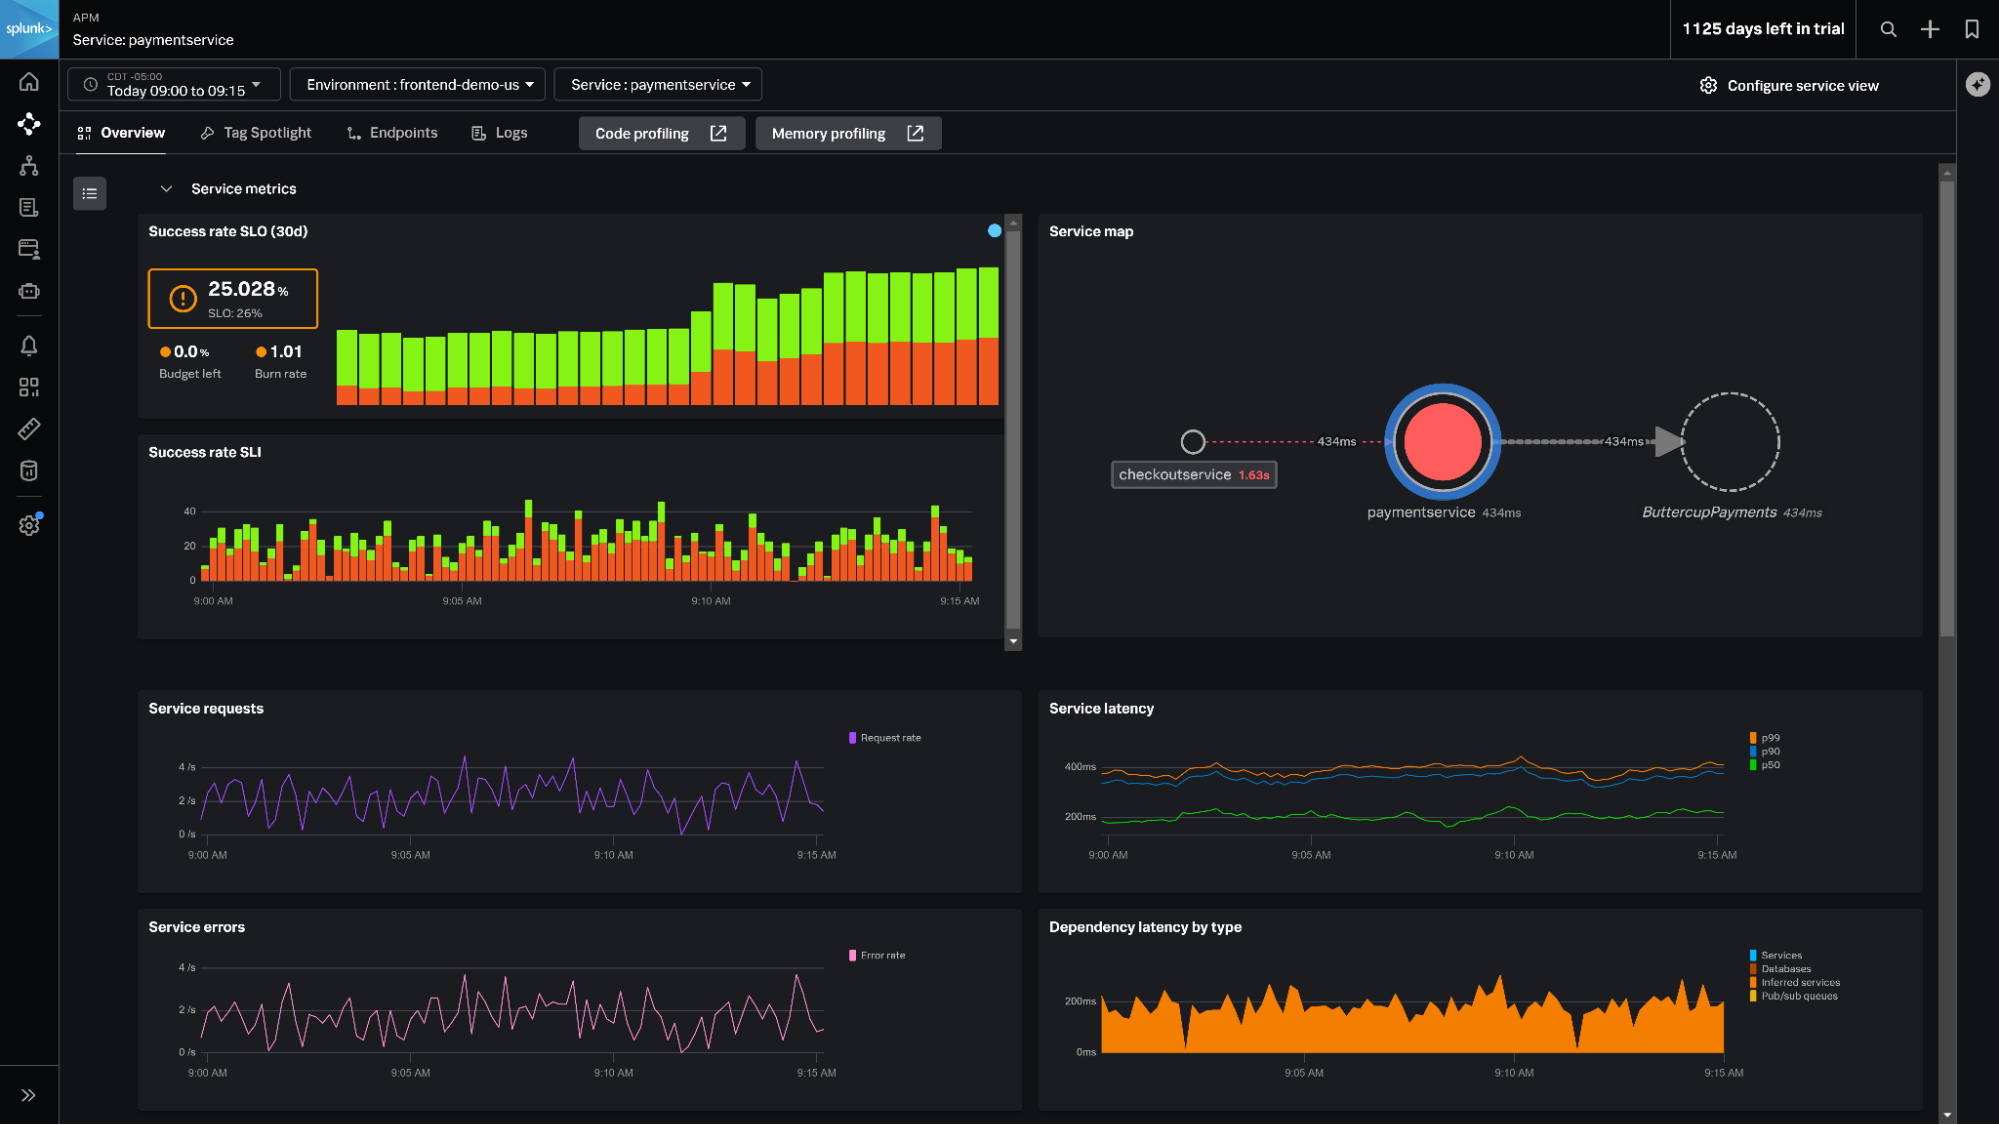
We’ve recently released Splunk IT Service Intelligence (ITSI) Service Sandbox which helps you easily map out and manage your IT services, along with APM Service Centric Views which brings in one place out-of-the-box view of your application service key data, including RED metrics, application logs, traces, and more. So you have a clear understanding of your IT health and your microservices and can be sure you’re not missing anything about the state of your backend systems.

Splunk APM’s Service Centric Views
Concerned about your front-end user experience? The new Configurable Downtimes in Splunk Synthetic Monitoring help front-end engineers access more reliable insights about their customer experiences by pausing synthetic tests during planned downtime windows.
But wait, there’s more!
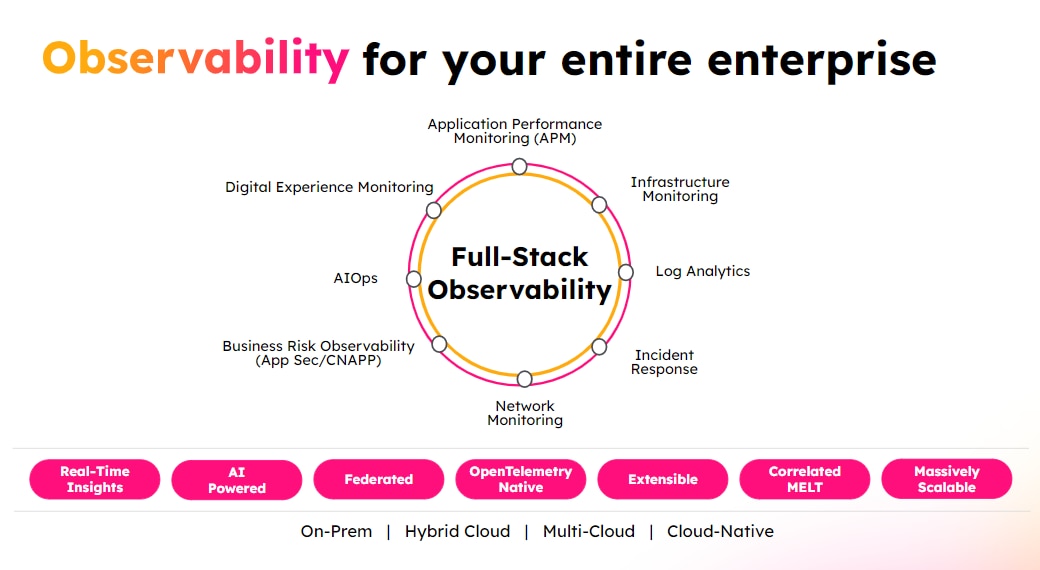
As you might already know, Cisco acquired Splunk in March and we couldn’t wait to start joining our forces! We are already building features that will tighten the connections between Cisco AppDynamics and Splunk Observability and bring full-stack observability to the entire enterprise. By combining Cisco’s unparalleled visibility into the network and traditional applications with Splunk’s leading log analytics and cloud-native observability, ITOps and engineering teams can instrument their entire business and eliminate blind spots.

Get more details about Splunk and AppDynamics integrations in this new blog by Tom Casey, Senior VP of Product and Technology.
Operate Faster Than Lightning, No Matter Your Level of Expertise
At Splunk, we strive to be at the forefront of innovation so engineering teams can perform at their best. This year is no different. We’re delivering more AI features and guided workflows that accelerate troubleshooting and make observability accessible to all engineers.
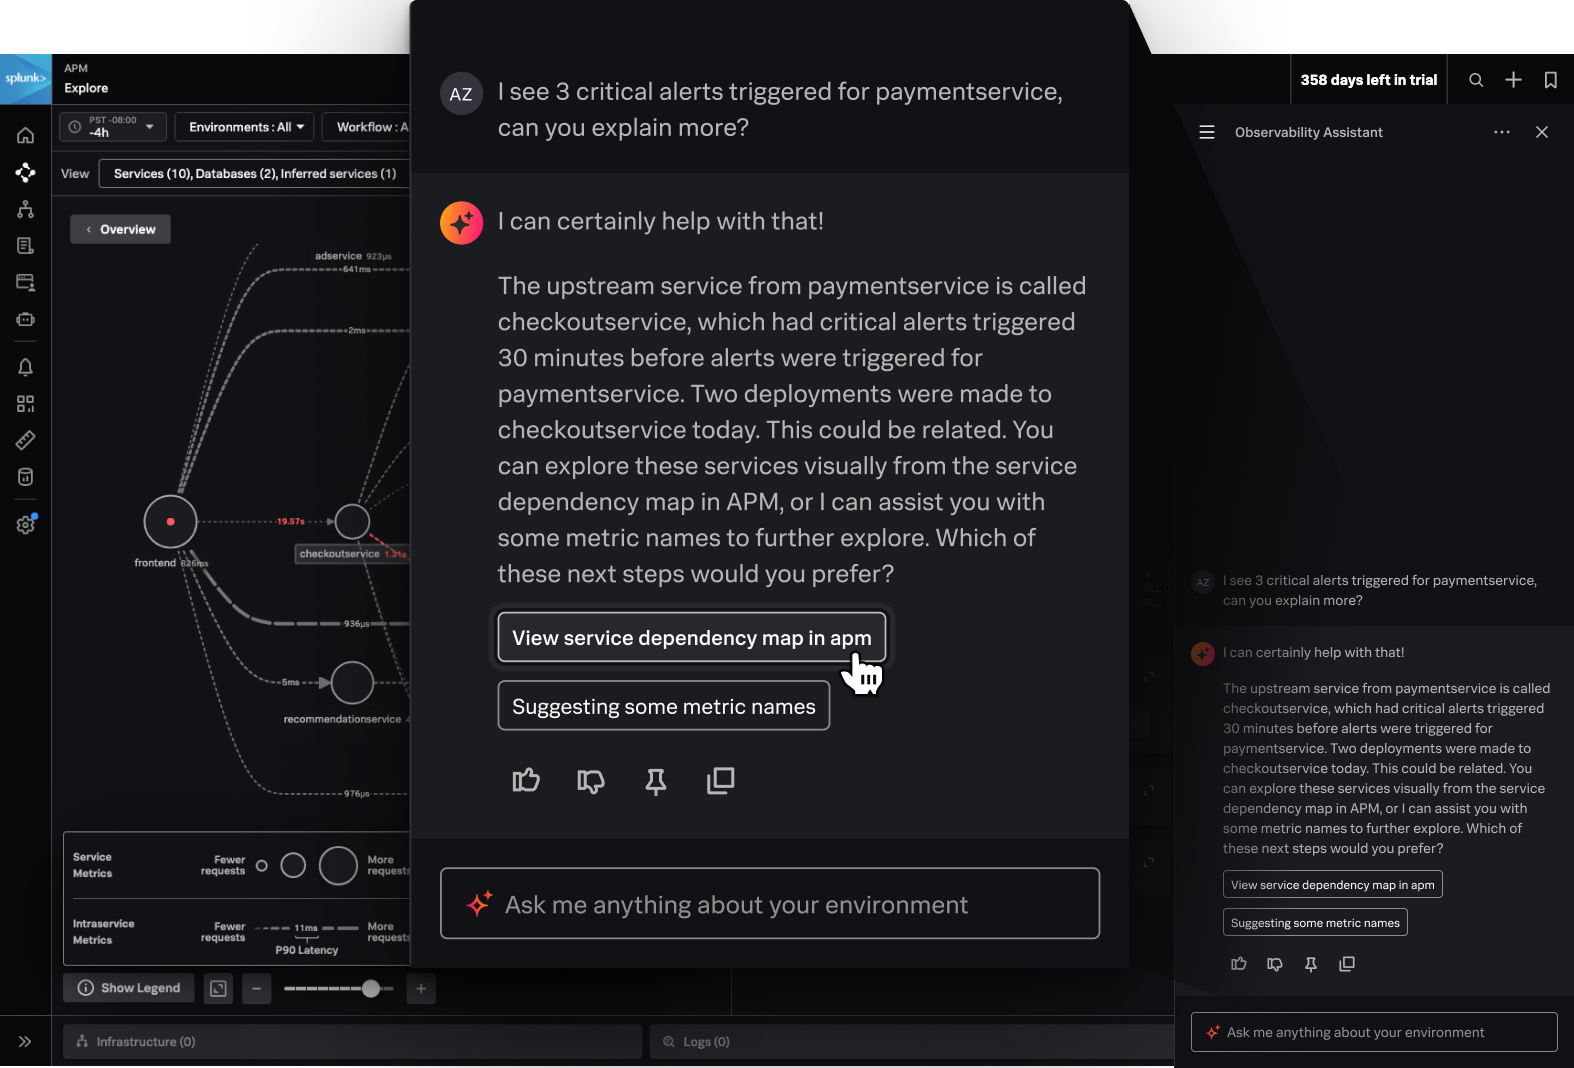
Are you new at Observability? Need to quickly familiarize yourself with Splunk? No need to fret. Introducing AI Assistant in Observability Cloud: our GenAI-powered chatbot experience that helps you find and fix issues faster using natural language. From "What's wrong with the payment service?" to "Why is the Kubernetes node down?", ask your questions to the new virtual Assistant and extract valuable insights about the state of your applications and infrastructure, accelerating your day-to-day tasks, root cause analysis, and response. Now, you can quickly and easily address failures or bugs in your digital systems, and become an observability pro.
While we’re still in the beta stages, we’re excited to have customers participate in our private preview program.
AI Assistant capabilities will be extended across all Splunk and Cisco Observability products so your experience is always consistent, no matter your solution.

AI Assistant in Observability Cloud
Check out the new Splunk ITSI Configuration Assistant, a one-stop shop to manage and optimize your IT configurations using AI and ML capabilities. We’re also streamlining troubleshooting for engineers with new dynamic navigator links from Splunk Observability Cloud alerts to Splunk Infrastructure Monitoring, so practitioners can transfer the alert context to the navigator and accelerate investigations of infrastructure-related incidents.
Scale Your Business the Right Way
As engineers, you are often responsible for optimizing your tech stack so your digital performance is aligned with your business growth strategy. That’s why we’ve released SLO Monitoring for Splunk Observability Cloud, a built-in service level objective (SLO) creation, visualization, and alerting that helps you easily and efficiently align service performance and reliability goals with business priorities.
We’ve also expanded the capabilities of Splunk Metrics Pipeline Management with Archived Metrics. This new cost-effective functionality allows you to dynamically route your less critical metric series data into low-cost cold storage, without any agent or code changes. Priced 90% lower than the real-time metrics tier, Archived Metrics ensure you don’t need to sacrifice insights for affordability!
Make Sure Your Entire Stack Is Covered
Like The Calling used to say, we’ll go wherever you will go, and we’re making sure our products will too. Later this year, we are committed to supporting more European-based organizations by expanding Splunk Observability Cloud’s regional availability to London and Frankfurt AWS realms. In addition, we’re excited to share that we’ll soon be extending Splunk ITSI’s and Cisco AppDynamic’s availability to Microsoft Azure, for more coverage of your stack.
Last but not least, Splunk is on a path towards achieving Federal Risk and Authorization Management Program (FedRAMP®) Moderate Authorization for Splunk Observability Cloud, allowing us to partner more closely with and support government agencies in their digital journeys.
We’re excited to bring you more ways to shield your digital systems from unwanted disruptions. If you’re deployed on a cloud or microservices environment, try Splunk Observability Cloud for 14 days. If you use traditional or monolithic applications, check out Cisco’s AppDynamics.
Follow all the conversations coming out of #splunkconf24!
Related Articles
About Splunk
The world’s leading organizations rely on Splunk, a Cisco company, to continuously strengthen digital resilience with our unified security and observability platform, powered by industry-leading AI.
Our customers trust Splunk’s award-winning security and observability solutions to secure and improve the reliability of their complex digital environments, at any scale.


