Detecting Dubious Domains with Levenshtein, Shannon & URL Toolbox

 In Parsing Domains with URL Toolbox, we detailed how you can pass a fully qualified domain name or URL to URL Toolbox and receive a nicely parsed set of fields that includes the query string, top level domain, subdomains, and more.
In this article, we are going to do some nerdy analytic arithmetic on those fields. So, if you haven’t read that previous post, go check it out and then come back here...we’ll wait.
.
..
…OK, you’re back!
So what do we mean by “nerdy analytic arithmetic”? Specifically taking those previously mentioned fields like domain and ut_domain, and trying to find the randomness of values or how close they are related to legitimate domains (or other strings) using Shannon and Levenshtein calculations.
(Part of our Threat Hunting with Splunk series, this article was originally written by Dave Veuve. We’ve updated it recently to maximize your value.)
Setting our hypothesis
As always, we like to begin with hypotheses when we hunt. Let’s start by using email events — we’ll hypothesize that adversaries try to fool users by sending phishing emails from addresses with domain names that closely resemble legitimate domains, usually known as typosquatting.
To detect these malicious domain permutations, we will use the Levenshtein distance between strings.
Levenshtein Distance
The Levenshtein distance was first considered by Vladimir Levenshtein in 1965. The distance is basically the number of changes made to transform one string to another. If one string is “hello!” and the other “hallo!,” the distance would be 1, as the “e” would be replaced with an “a.”
With that background, let’s look at an example with URL Toolbox.
index=email mail from
| stats count by Sender
| rex field=Sender "\@(?<domain_detected>.*)"
| stats sum(count) as count by domain_detected
| where domain_detected!="mycompany.com"
| eval list="mozilla"
| `ut_parse_extended(domain_detected, list)`
| eval company_domain="mycompany.com"
| `ut_levenshtein(ut_domain, company_domain) `
| eval ut_levenshtein= min(ut_levenshtein)
| where ut_levenshtein < 3

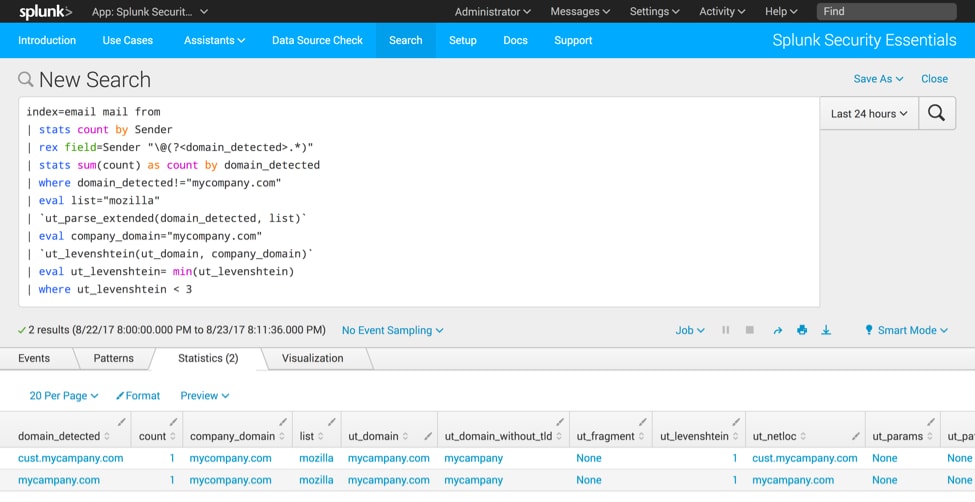
In this example, we own the domain “mycompany.com” and someone tried to trick us by sending an email from a domain called “mycampany.com”! The first five lines of the search extract the domain and run the `ut_parse_extended(2)` macro against the domain (we covered that in our last post).
The new part of this search runs the macro `ut_levenshtein(1)` against the newly extracted ut_domain field and compares it to our legitimate domain. As seen in the screenshot above, that distance is one, easily detected by our rule. (Most customers I’ve surveyed use a threshold of 1-2 for alerting; anything more than 2 and you risk getting lots of false positives.)
The same technique can be used against any data source. Let’s alter our hypothesis to assume that users receiving phishing emails will not notice typosquatting in a link they click. Here’s an example looking for just that scenario with the domain “mycompany.com.”
index=pan_logs sourcetype=pan:threat url=*
| stats count by url
| eval list="mozilla" | `ut_parse_extended(url, list)`
| stats sum(count) as count by ut_domain
| where ut_domain!="mycompany.com"
| eval company_domain="mycompany.com"
| `ut_levenshtein(ut_domain, company_domain)`
| eval ut_levenshtein= min(ut_levenshtein)
| where ut_levenshtein < 3

I’ve grayed out the commands that are the same as our first example – to look at a totally different data set, the only changes we need was to:
- Change the sourcetype.
- Parse the URL.
URL Toolbox also supports multi-value fields, allowing us to detect the use of subdomains that try to trick us, as well as allowing us to monitor multiple domain names (since everyone has multiple domain names in their organizations). This search is a bit longer, but it’s worth it! Again, this is very similar to the search in Splunk Security Essentials under the header of “Emails with Lookalike Domains,” so you can go see it there if you’d like as well.
Let’s continue with our original hypothesis around phishing emails, but broaden it to include multiple domains as well as subdomains.
index=email mail from
| stats count by Sender
| rex field=Sender "\@(?<domain_detected>.*)"
| stats sum(count) as count by domain_detected
| eval domain_detected=mvfilter(domain_detected!="mycompany.com" AND domain_detected!="company.com" AND domain_detected!="mycompanylovestheenvironment.com")
| eval list="mozilla"
| `ut_parse_extended(domain_detected, list)`
| foreach ut_subdomain_level* [eval orig_domain=domain_detected, domain_detected=mvappend(domain_detected, '<<FIELD>>' . "." . ut_tld)]
| eval domain_names_analyzed=mvappend(domain_detected, ut_domain), company_domains_used = mvappend("mycompany.com", "company.com", "mycompanylovestheenvironment.com")
| `ut_levenshtein(domain_names_analyzed, company_domains_used) `
| eval ut_levenshtein= min(ut_levenshtein)
| where ut_levenshtein < 3
| fields - domain_detected ut_*
| rename orig_domain as top_level_domain_in_incoming_email count as num_occurrences ut_levenshtein as Levenshtein_Similarity_Score

The process of the search is like the single domain search, but adds logic for handling multi-value fields.
Shannon Entropy
Okay, let’s move from Levenshtein and look at Shannon Entropy detection. Shannon Entropy is named after Dr. Claude Shannon, who conceived of entropy within information in 1948. The basic gist of information entropy is that it allows us to determine the amount of randomness present in a string. For example, google.com has an entropy score of 2.65, but c32DyQG9dyYtuB471Db.com has an entropy score of 4.2! Using this technique provides us the ability to hunt for algorithmically-generated domain names.
In this example, I am starting with a hypothesis that malware in our network uses randomized domain names to communicate with other malicious infrastructure.
index=pan_logs sourcetype=pan:threat url=*
| stats count values(src_ip) as src_ip by url
| `ut_parse_extended(url, list)`
| stats sum(count) as count values(src_ip) by ut_domain
| `ut_shannon(ut_domain)`
| search ut_shannon>3

In our search, we focus on identifying URLs, performing a statistical calculation to get a count by URL, and then using the URL Toolbox macro `ut_parse_extended(2)` to parse out the domain. After the domain is parsed, we use the `ut_shannon(1)` macro to calculate the entropy score for each domain. After we calculate the entropy, we then perform some additional statistical calculations and format for viewing.
In the example above we look for any domains with entropy greater than 3. This cut off will be different in every dataset, adjust it as needed until you have low false positives.
Extending the search we just created, we could hypothesize that adversaries will attempt to exfiltrate data via dns. To assist us, we will refine our search by adding in a few more statistics. This query allows us to detect data exfiltration via the tool dnscat2 (or dnscat). dnscat2 asks for a domain name that the attacker owns, and then encrypts, compresses, and chunks files. To exfiltrate, it generates a lot of DNS requests for random subdomains (the exfiltrated data) within that domain.
Since the attacker owns the domain name and is listening for the requests, they can successfully capture and recreate the data on their server. No firewall holes are needed and NGFW detection is impossible because it appears to be DNS traffic from your DNS server!
Let’s see how we might hunt for this kind of data using the stats command.
index=bro sourcetype=bro_dns
| `ut_parse(query)`
| `ut_shannon(ut_subdomain)`
| eval sublen=length(ut_subdomain)
| stats count
avg(ut_shannon) as avg_sha
avg(sublen) as avg_sublen
stdev(sublen) as stdev_sublen
by ut_domain
| search avg_sha>3 avg_sublen>20 stdev_sublen<2

Oh my! We start by parsing the query, just like we’ve always done. We calculate entropy on the subdomain and then start generating a count, average, and standard deviation based on the subdomain and entropy. Once calculations have been made, it's easy to filter down the results and sort to view.
While we've spent a good chunk of time on domains, it is important to understand that we can apply the same entropy techniques on any field in Splunk including file names on the local operating system. We could hypothesize that an adversary is launching processes from a user’s profile using randomized file paths:
sourcetype=win*security EventCode=4688 New_Process_Name=*\Users\*
| `ut_shannon(New_Process_Name)`
| stats values(ut_shannon)  as "Shannon Entropy Score" by New_Process_Name, host
| rename New_Process_Name as Process, host as Endpoint

One note here — the usefulness of Shannon Entropy decreases as the string length increases. We’re looking to build machine learning-based randomness detection in Splunk Enterprise. If you’ve got a hankering for a beta test, reach out!
You might be thinking, can we use Levenshtein for files if we can use Shannon entropy for files? Absolutely—Levenshtein can be used for typo-squatting processes! I might hypothesize that adversaries will hide processes from administrators by launching filenames that are very similar to legitimate Windows processes like explorer.exe, iexplore.exe, svchost.exe, or services.exe.
sourcetype=win*security EventCode=4688
| rex field=New_Process_Name "(?<filename>[^\\\\/]*$)"
| stats values(host) as hosts dc(host) as num_hosts values(Image) as Images by filename
| eval goodfilenames=mvappend("svchost.exe","iexplore.exe","ipconfig.exe","explorer.exe")
| `ut_levenshtein(filename, goodfilenames)`
| where min(ut_levenshtein) < 3 AND min(ut_levenshtein) > 0

WHEW.
Now that wasn’t too bad, was it? Several different examples of using `ut_shannon(1)` and `ut_levenshtein(1)` to find badness with just math.
One more app: Meet JellyFisher
If all of this is very exciting to you and you want more, we'll leave you with one last area to explore. One more app, called JellyFisher. JellyFisher is less flexible than URL Toolbox—without the same support for multi-value fields or caching—but it does add new algorithm choices, including Damerau-Levenshtein. This is like Levenshtein, but slightly better in that swapping two characters (like the “l” and “p” to create slpunk.com) only count as a distance of one. This means superior detection of adversary nastiness! If you’re curious, check out the docs and go try out some new use cases.
For more examples of Shannon Entropy check out these blogs by Ryan Kovar and Sebastien Tricaud:
Until next time, happy hunting! :-)
Related Articles
About Splunk
The world’s leading organizations rely on Splunk, a Cisco company, to continuously strengthen digital resilience with our unified security and observability platform, powered by industry-leading AI.
Our customers trust Splunk’s award-winning security and observability solutions to secure and improve the reliability of their complex digital environments, at any scale.


