| |
Splunk |
New Relic |
| Log Analytics |
Our metrics and full fidelity traces correlate well with logs, so users can find and resolve issues quickly. Proven indexing and search scale across enterprise datasets lets you fast-track finding what you need when you need it. |
Minimal log file correlation and reports of slow, inefficient searches make querying or troubleshooting log data challenging. New Relic does not ingest all log file types or use related content for log file analytics. Without automatic field tagging in unstructured data, log usability is limited without manual designation. |
Detection & Alerting
|
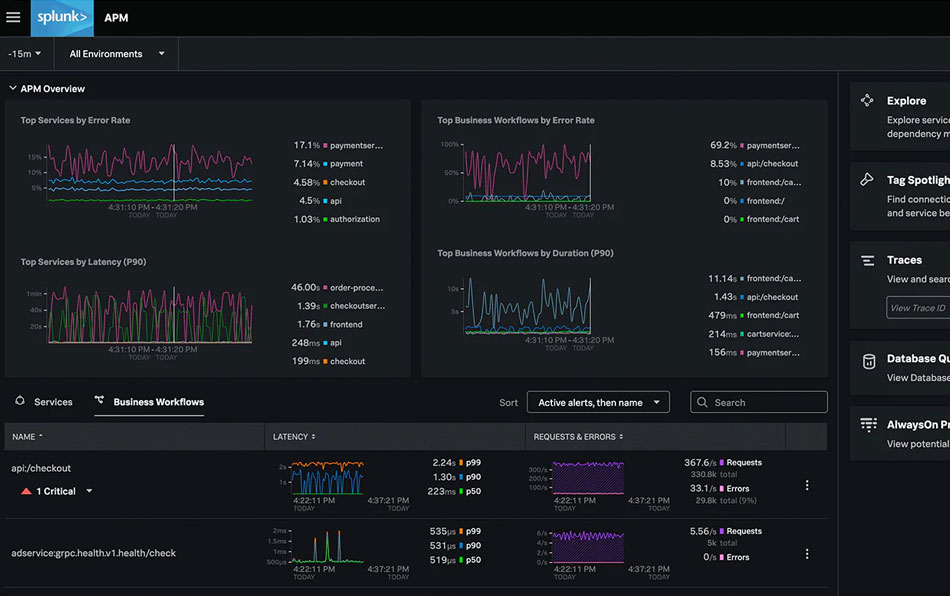
Splunk's real-time streaming architecture collects data in one-second intervals and reports in <10 seconds. This enables you to visualize, analyze, and alert on changes in seconds, so you can spot and fix problems faster in cloud-native applications and infrastructure. |
New Relic agents can collect granular data. They use batch processing to poll telemetry data, typically reporting in one-minute intervals leading to slower detection and alerting for any issues. |
| Data Retention & Integration |
Splunk captures, visualizes, and analyzes every time-series metric, trace, log, and event down to the line of code so you don’t miss any critical signals. Plus, Metrics Pipeline Management lets you control metrics volume at the point of ingestion to optimize observability spend. |
New Relic tracing can collect 100% of trace data from web browsers and mobile apps, but they sample backend traces. This leads to disconnected and duplicated spans, which can slow troubleshooting, increase costs and make it harder to isolate problems. |
| Troubleshooting Experience |
Cohesive and comprehensive troubleshooting workflows in Splunk Observability Cloud allow engineers to start from a user, service, application or infrastructure layer, identify what’s affected and isolate what’s broken quickly and easily. Using Splunk IT Service Intelligence, ITOps teams can quickly connect IT service health with business impact to track lost revenue, identify which users require triage, and facilitate enterprise-wide communication. |
Disconnected and isolated products and capabilities make it hard for users to know where to begin. Users have redundant, disconnected experiences navigating from product to product, particularly with New Relic Explorer, Lookout, Navigator, Time Warp and Workloads, due to overlapping functionality and built-in APM and Infrastructure Monitoring dashboards. |
| OpenTelemetry Support |
Splunk uses an OpenTelemetry collector as our native telemetry collection mechanism and is a significant contributor to the project. Users can confidently collect, process, transform, visualize and alert on OpenTelemetry data without worrying about exceptions and OpenTelemetry-specific constraints. They can directly contribute to the community and fully realize the business value of OpenTelemetry for their enterprise. |
While New Relic is associated with Cloud Native Computing Foundation, (CNCF) and does have OpenTelemetry agents, it doesn’t allow users to visualize or export data easily, reducing the likelihood that customers realize the full OpenTelemetry business benefits. |