false

PRODUCT FEATURE DETAILS

Splunk® Enterprise Product Features

Connected Experiences


Empower more users by delivering insights without having to be chained to your desk.
splunk-mobile
 
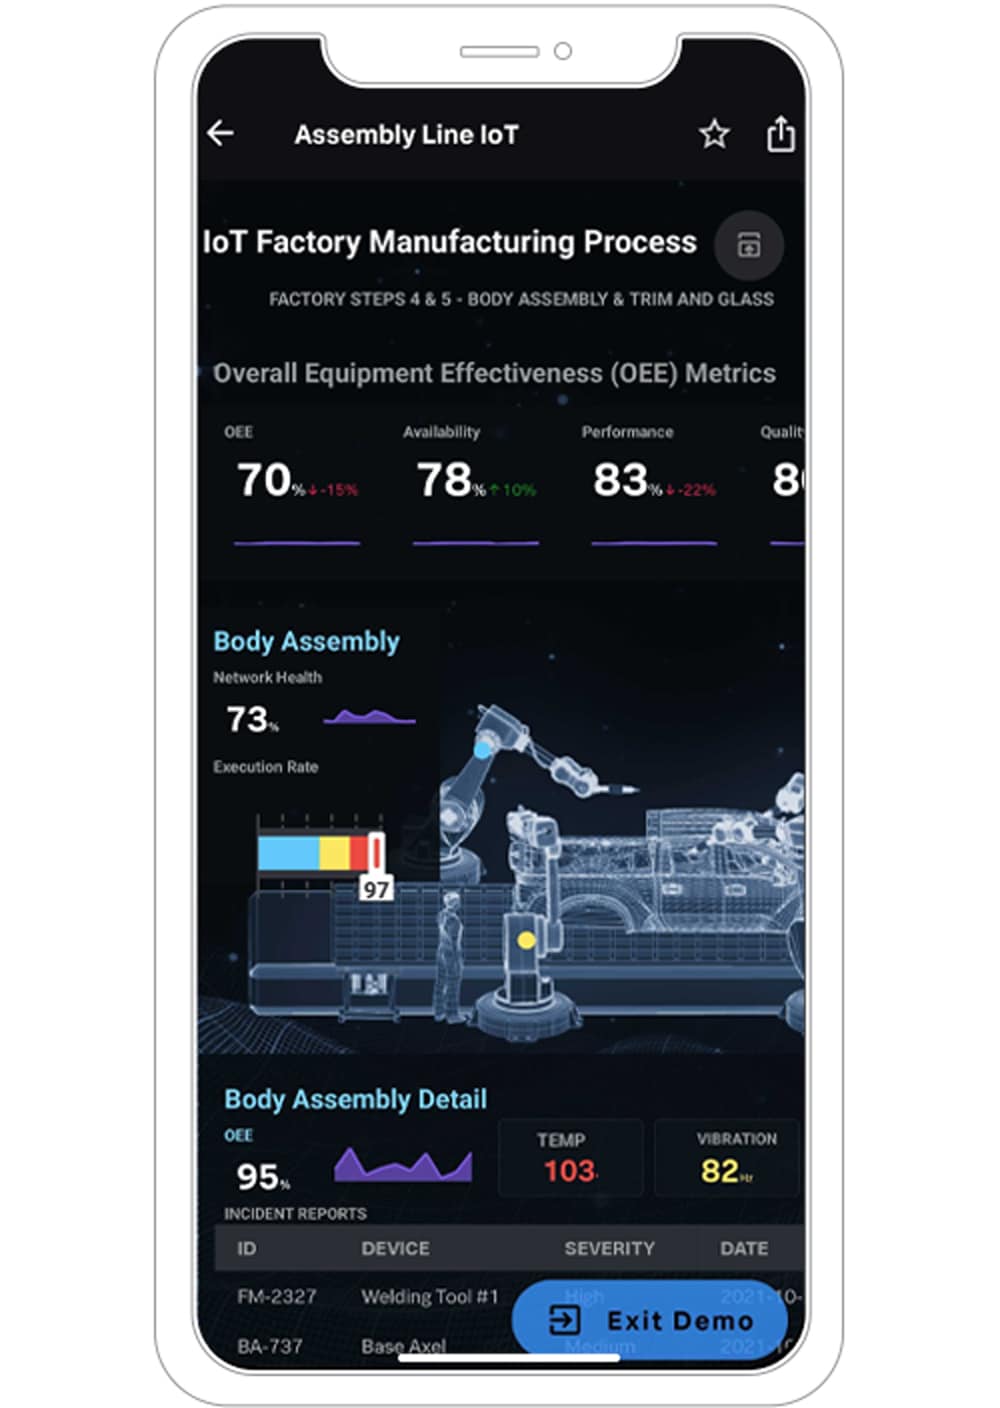
Splunk Mobile

Splunk at your fingertips

View mobile-friendly dashboards, and receive and take action on alerts from your mobile device, allowing you to stay up to speed on your business, wherever you are.

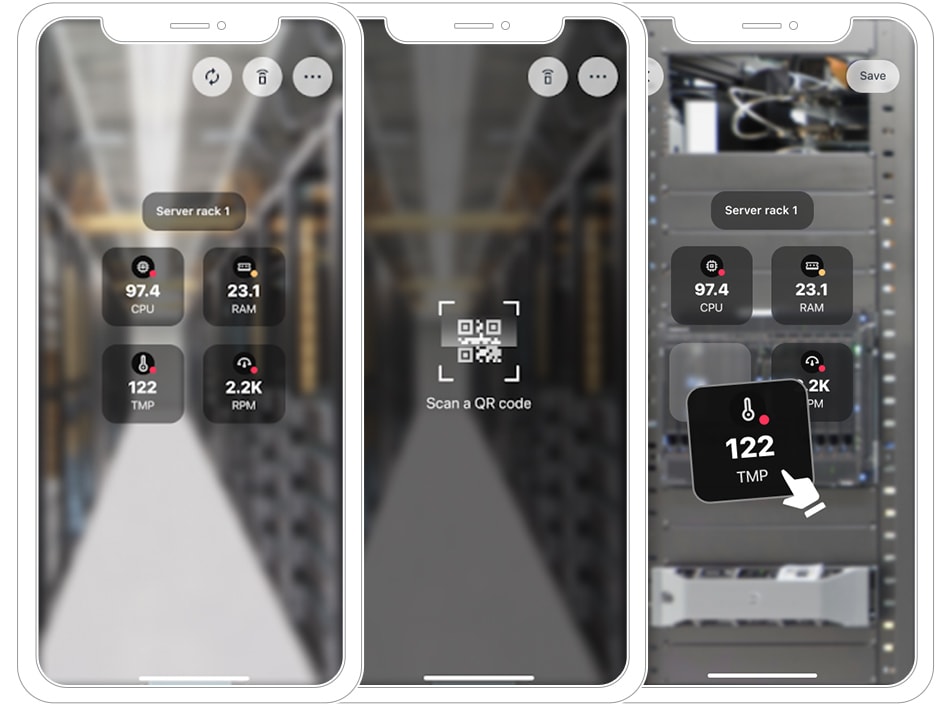
Splunk AR (Augmented Reality)

Experience your data

Experience your data and Splunk dashboards on the objects themselves, and provide non-SPL users the value of Splunk insights.
augmented-reality
Splunk AR (Augmented Reality)

Experience your data

Experience your data and Splunk dashboards on the objects themselves, and provide non-SPL users the value of Splunk insights.
splunk-tv
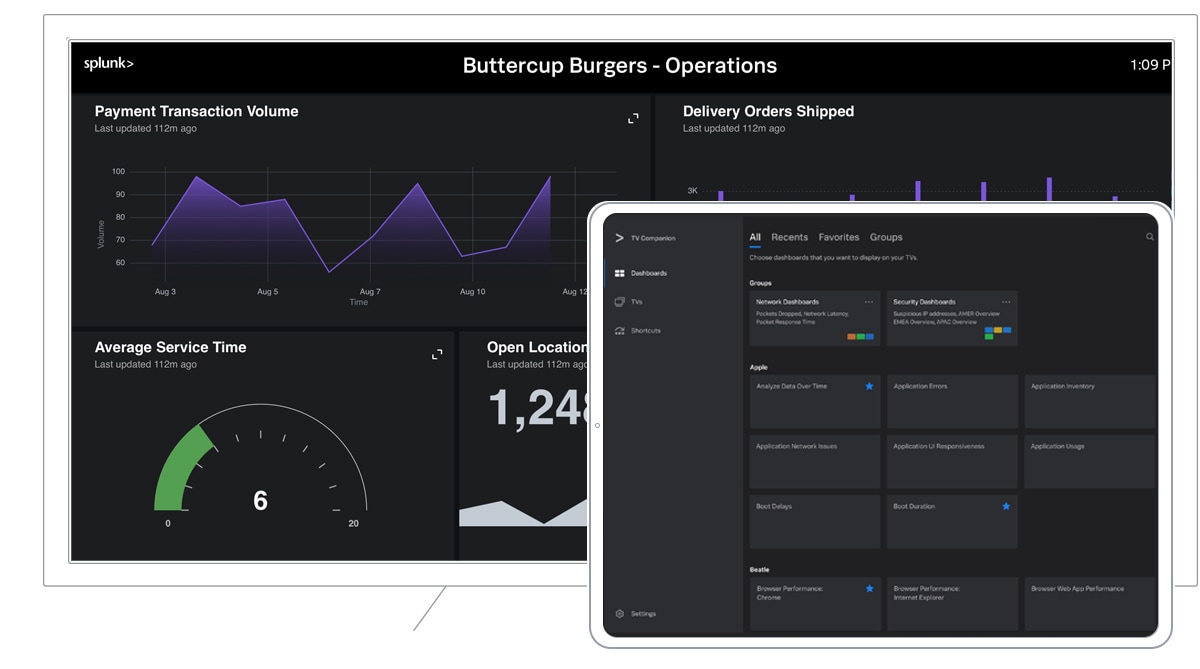
SPLUNK TV, SPLUNK TV COMPANION

Secure, beautiful displays

Display your Splunk Dashboards in office, NOC or SOC environments using Apple TV, Android TV or Fire TV — and remotely control the content with Splunk TV companion.
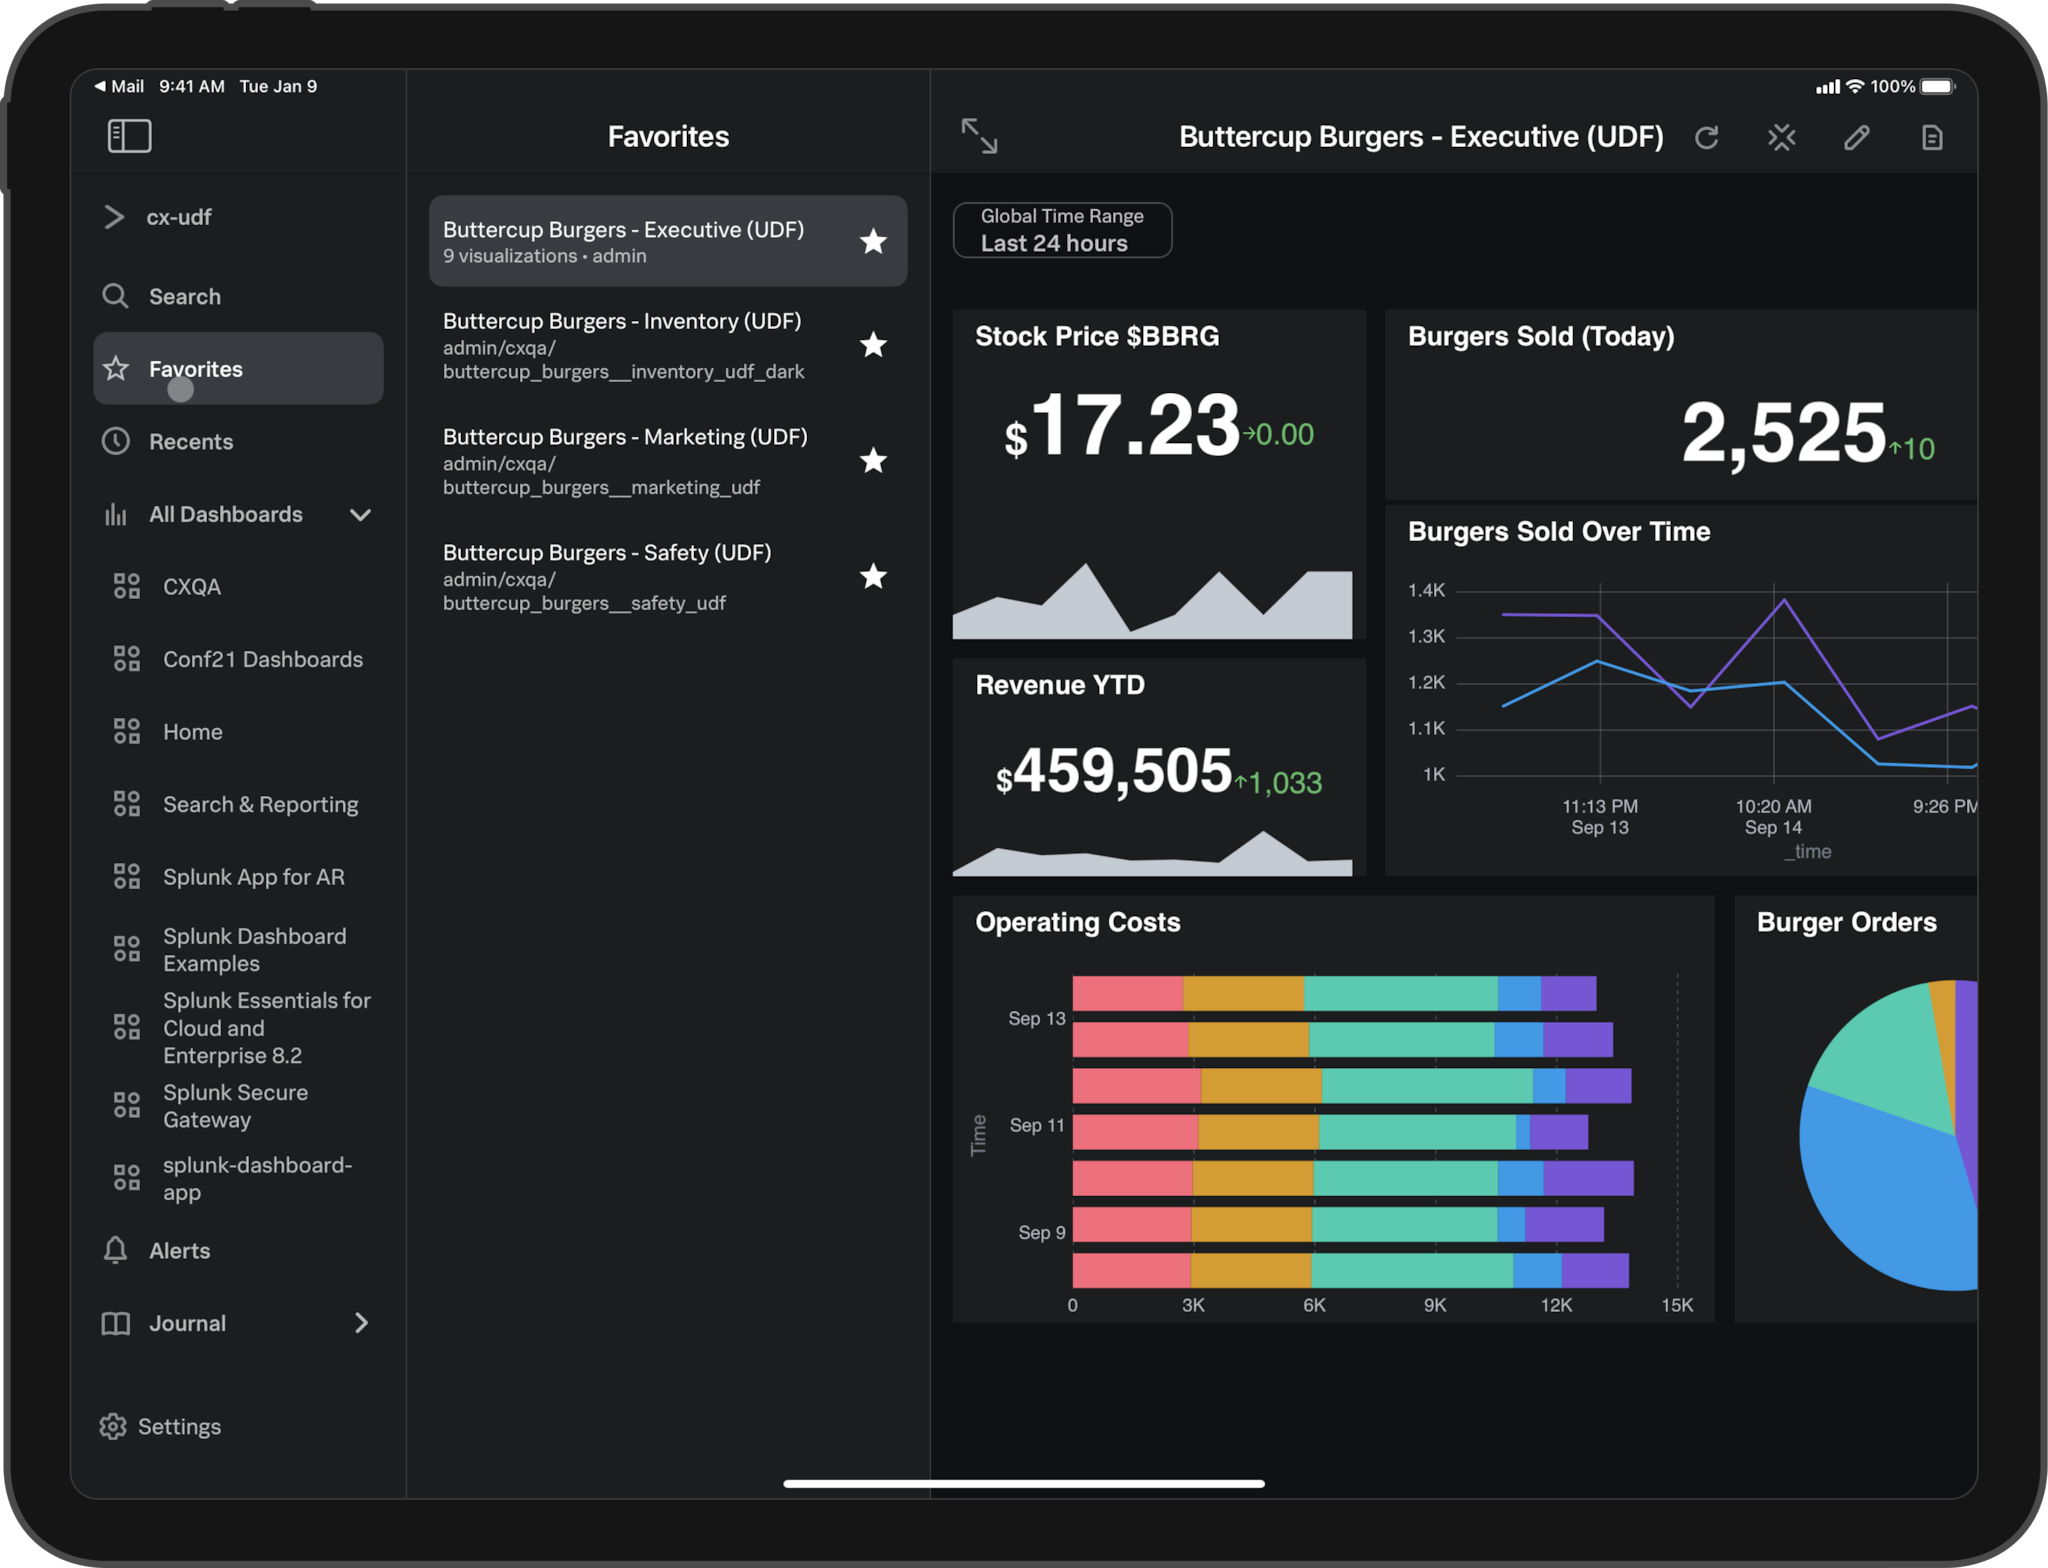
splunk-for-ipad
SPLUNK FOR iPAD

Splunk data on a large portable screen

Collaborate with your team to view dashboards optimized for iPad, annotate visualizations and keep a data journal so you can make better, faster decisions on the go.

SPLUNK SECURE GATEWAY

Enable Connected Experiences

Manage your fleet of mobile devices at scale in the Splunk Secure Gateway app, which easily and securely communicates with Splunk platform instances using Spacebridge, an end-to-end encrypted cloud service. 

Spacebridge has been certified to meet SOC2, Type 2 and ISO 27001 standards and is HIPAA and PCI-DSS compliant. 

Dashboards and Visualizations


Customized dashboards and data visualizations give voice to your data.


Customized dashboards and data visualizations give voice to your data.
VISUALIZATIONS

Show the beauty in your data

Choose from a wide range of charts and other visualizations to tell a data story that is compelling and actionable. Intuitive and interactive tools make sense of complex data, empowering you to identify issues and opportunities.

vizualization-dashboard-example
Dashboards

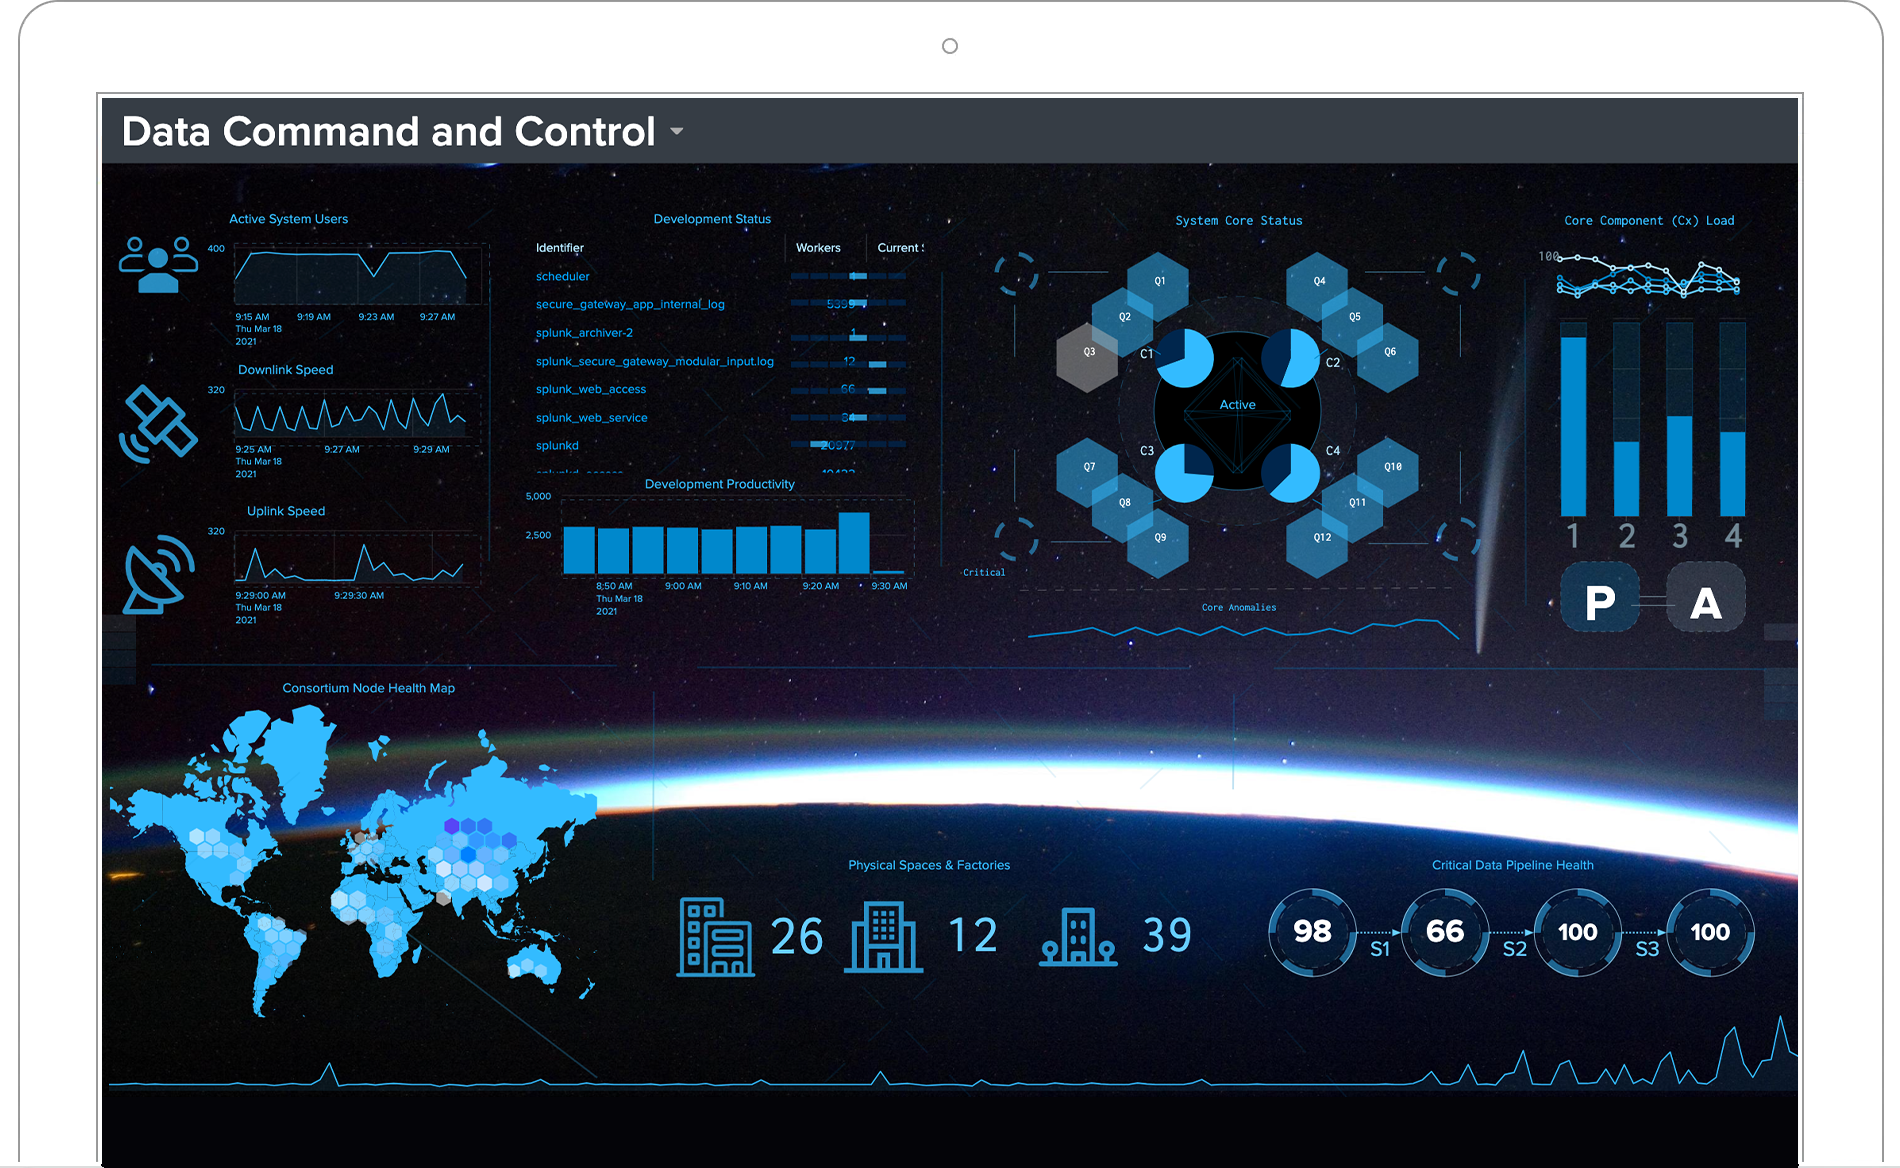
Tell a story with your visualizations

Dashboards integrate charts, reports and re-usable panels to display a comprehensive data story. Build and personalize dashboards to display the most relevant information for different audiences and use cases. Additionally, use the same data and tailor it specifically for management, business and security analysts, auditors, developers, and operations teams to help them act fast.

Monitoring and Alerting

Monitoring

Greater visibility into your operations

Continuous monitoring of events, conditions, and critical KPIs helps keep your operations running smoothly. With scheduled searches you can create real-time dashboards and visualizations that keep your team and management informed. Out-of-the box monitoring dashboards for common IT, security, and application environments are also available in the Splunkbase app store.

ALERTING

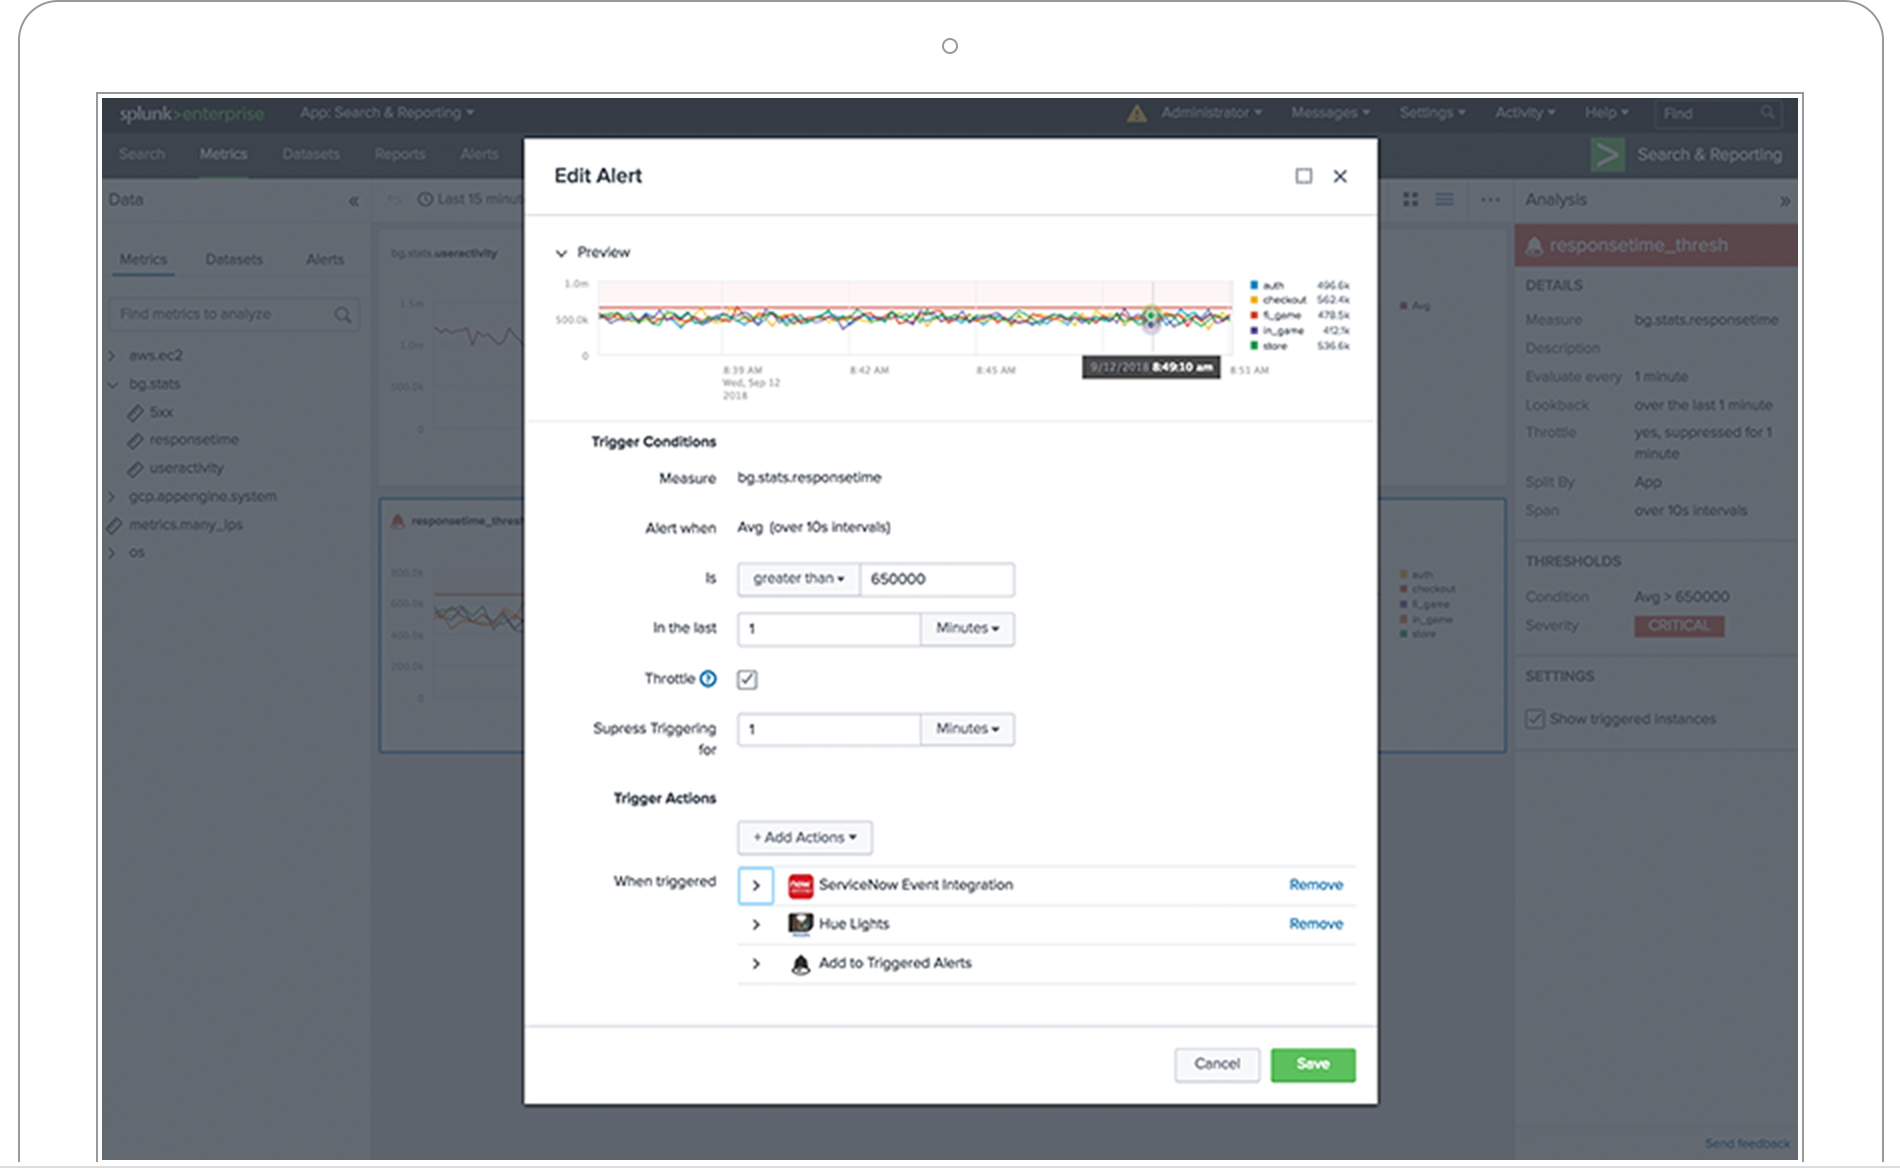
Get your critical alerts in real-time

custom-alerts

Alerts can signal critical events and impending conditions in real-time. Splunk's custom alert actions feature makes it simple to automatically kickoff subsequent action (think: sending emails and executing remediation scripts) when an alert is triggered. Further, these custom alerts can be set to varying levels of granularity based on a variety of conditions (e.g. data thresholds, trend-based conditions, and behavorial pattern recognition, like abandoned shopping carts, brute force attacks, and fraud scenarios).

Reporting

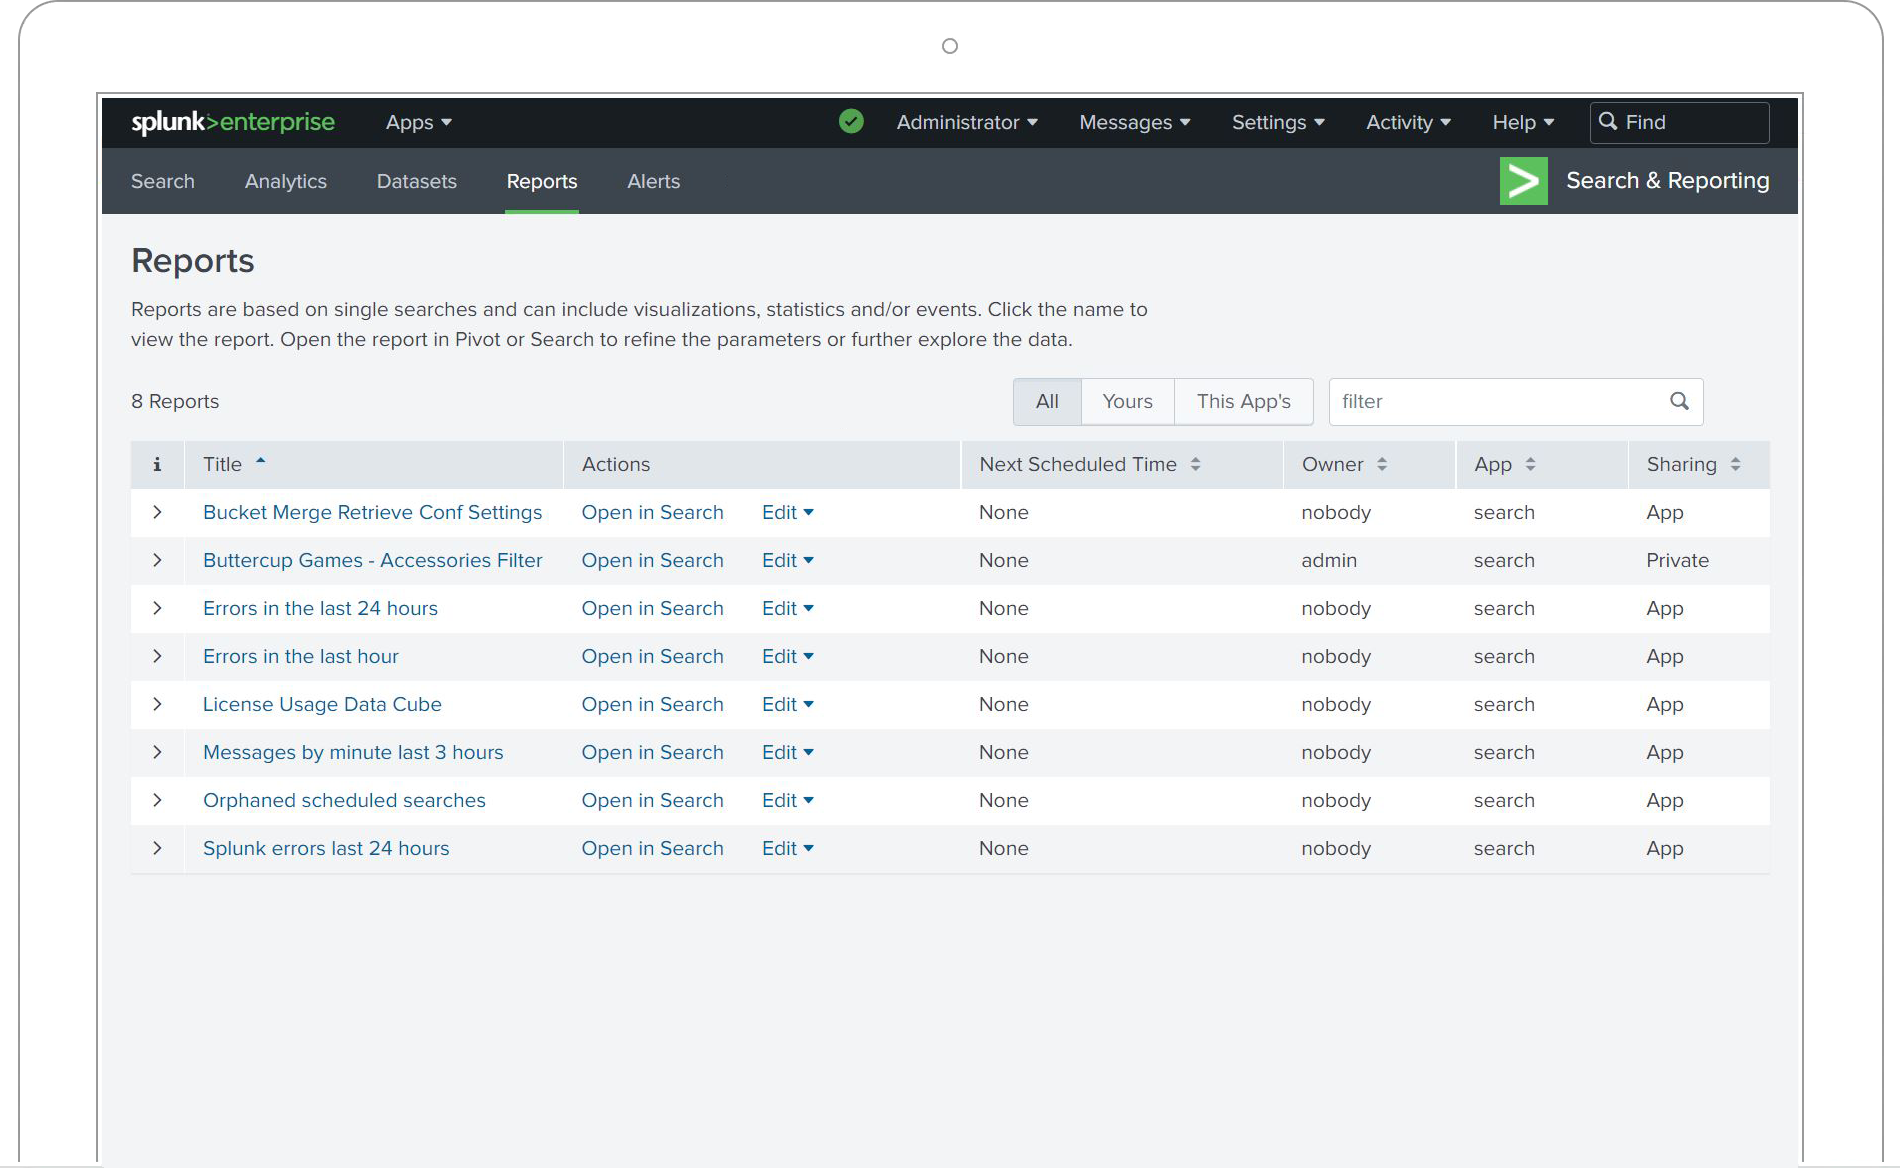
Reports can be created in real time, scheduled to run at any interval and used in your dashboards. They can also be saved and shared in secure, read-only formats like PDFs via ODBC.

splunk-reporting

Metrics

Metrics

Quickly and visually analyze your metrics and events data


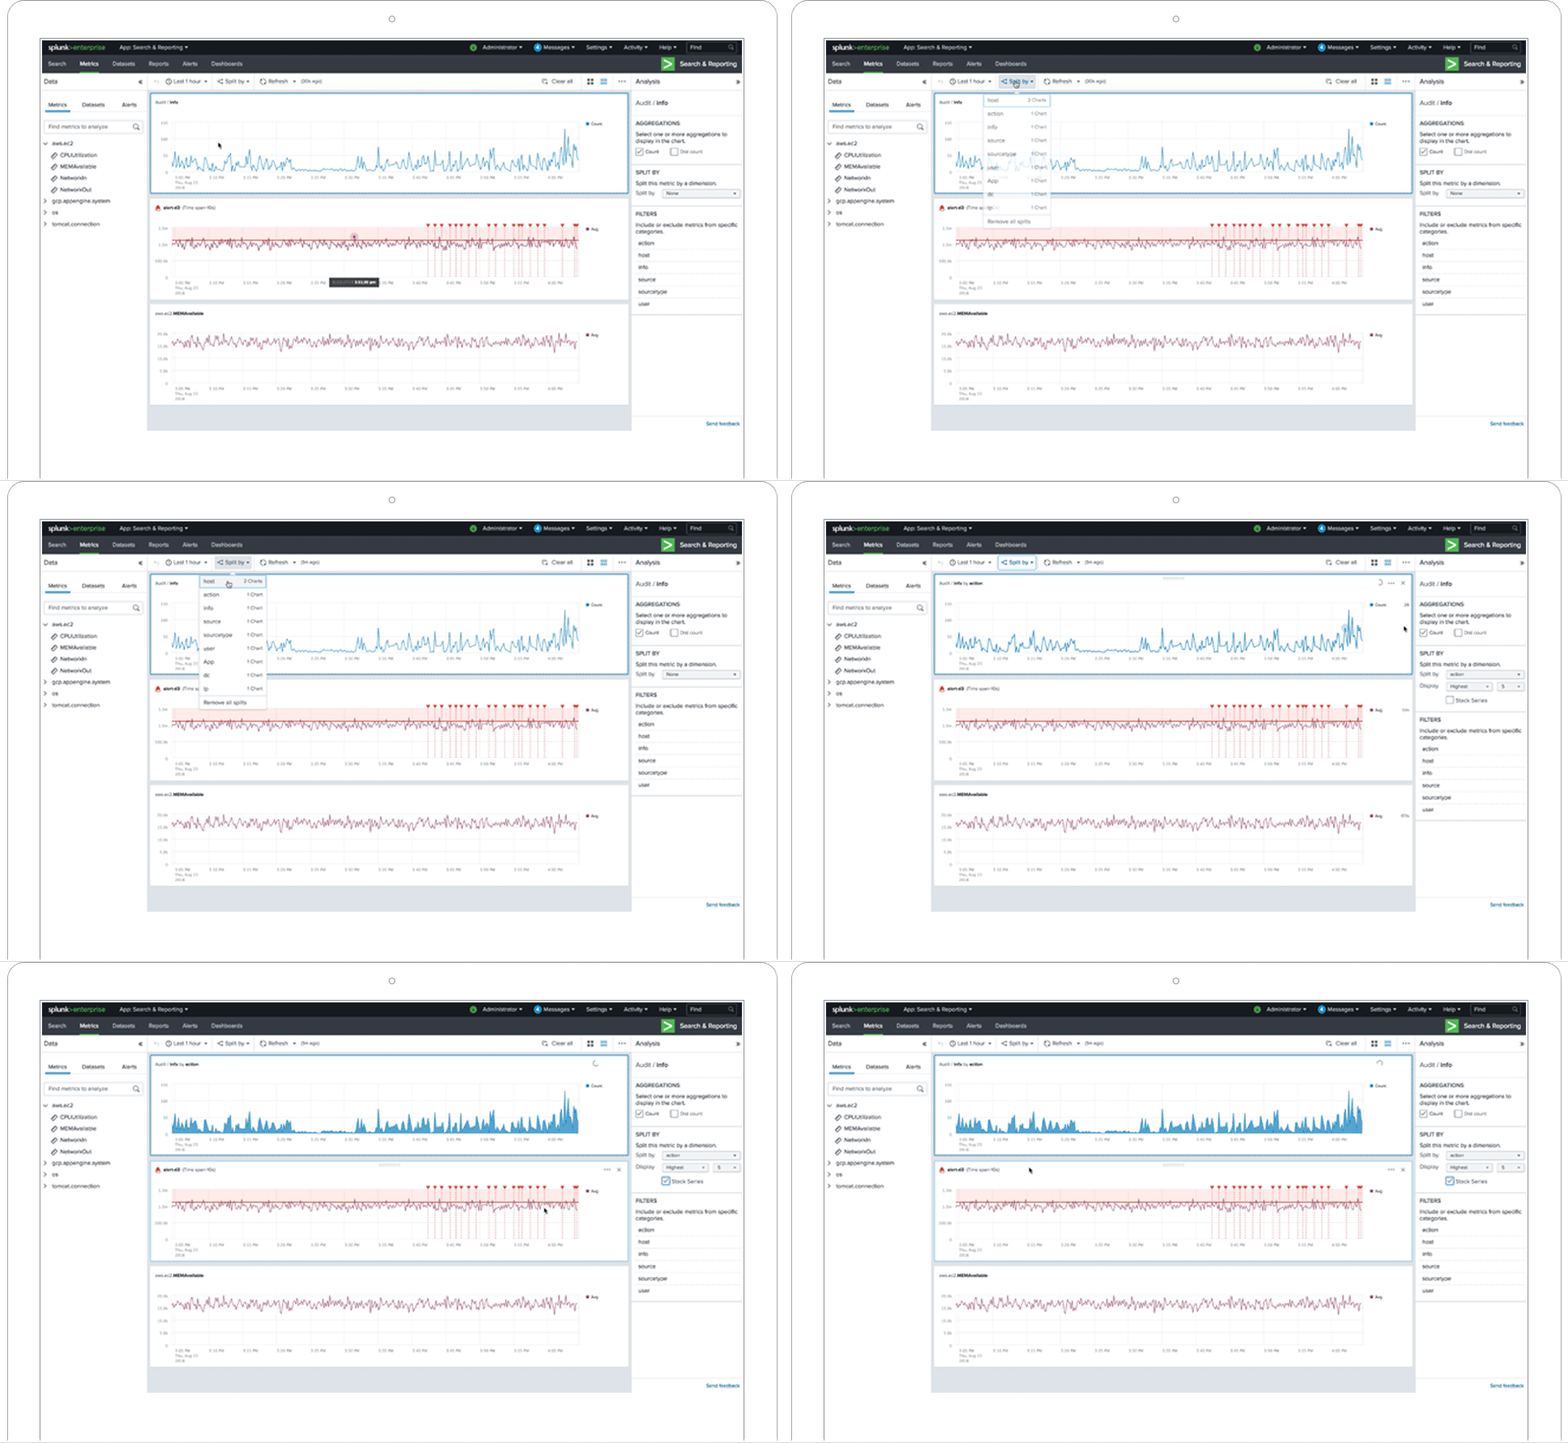
Splunk allows for complete utilization of metrics data to boost search performance and save in data storage costs. And now with Analytics Workspace, you don't need to know SPL to browse, analyze and transform large (or small) metrics data sets or compare them with other events or non-metrics data. Accelerate time to action with easy-to-use, visual data analysis capabilities of the Analytics Workspace.

Logs to Metrics. Metrics data are numerical data points captured over time that can be compressed, stored, processed and retrieved more efficiently than logs. Scale your ability to use this data type by converting your logs into metrics.

Analytics Workspace. The Analytics Workspace is the place to quickly visually analyze metrics and events data, and take action. Technical and non-technical users can now analyze metrics as well as non-time series data with charts and visualizations such as bar charts, column charts, reference lines, and scatter plots in a visual-friendly environment. Create better performing alerts in a few quick steps directly from visual analysis results.

We chose Splunk to help us monitor and manage our mobile battery systems in the field... Now we can proactively maintain our battery systems on customer sites which enables us to improve the overall customer experience.

David Lee
Technical Architect, FreeWire Technologies

Machine Learning Toolkit (MLTK)

MLTK

Incorporate AI and Machine Learning into your data strategy

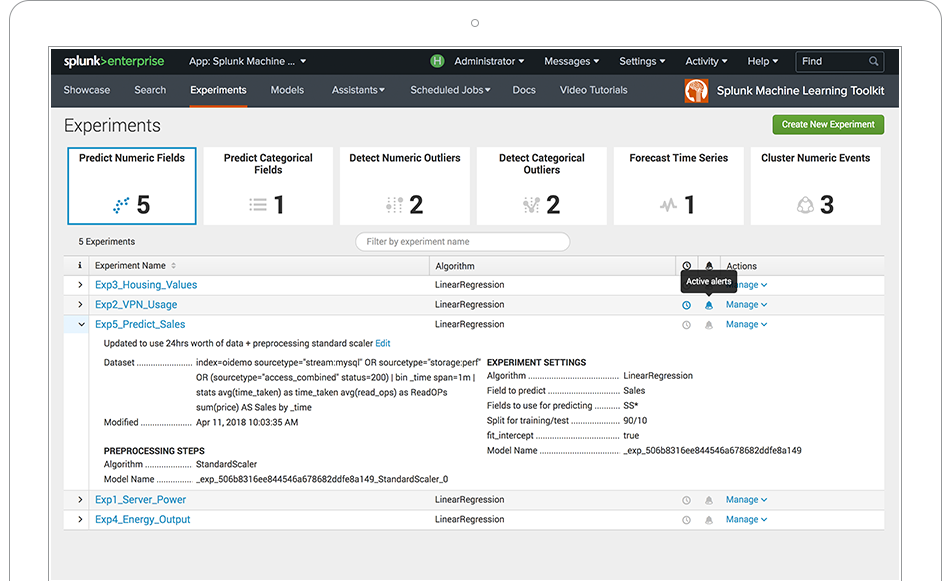
Use pre-built Splunk machine learning analytics for idenfitied use cases or create your own custom machine learning models to tackle impactful issues or opportunities in your company. Splunk Machine Learning Toolkit supports custom machine learning model development through guided assistants, providing flexibility if you want to go beyond configuring a pre-built solution. The MLTK extends the Splunk platform with outlier and anomaly detection, predictive analytics and clustering to filter out the noise. Leverage pre-packaged and open source algorithms to operationalize your data with machine learning in your production environment. New, smart assistants have an easier-to-use, GUI-based approach that guide you through each step of the process, writing SPL in the background that you can review later for insight into further customization.

Splunk Machine Learning Toolkit, and the new Splunk Community for MLTK Algorithms on GitHub enables our Professional Services Consultants to deliver broader and more valuable data science and machine learning solutions. We can now use the most appropriate algorithm to solve complex business problems in a clean, consistent and supportable manner, which means our customers get more powerful, focused solutions and a much more satisfying experience.

Michael Cormier
Founder, Managing Director, Concanon

Scale and Manageability

SmartStore

Bold next-generation architecture

SmartStore maximizes data management flexibility while maintaining search performance by allowing compute (CPUs) and data storage to be independently scaled up or down based on business demands. It automatically evaluates users’ data access patterns via an application-aware cache and places actively accessed data in local storage for real-time analytics and unused/inactive data in lower-cost, remote storage.

This maximizes scalability and data availability by expanding data retention capabilities while significantly lowering cost of ownership and increasing flexibility with built-in applications and an index-aware cache. Additionally, it simplifies indexer maintenance as all data gets pushed to remote storage to assist with patching, upgrading or replacing indexes without impacting data integrity.

Splunk Monitoring Console

Operational visibility for your on-prem lifestyle

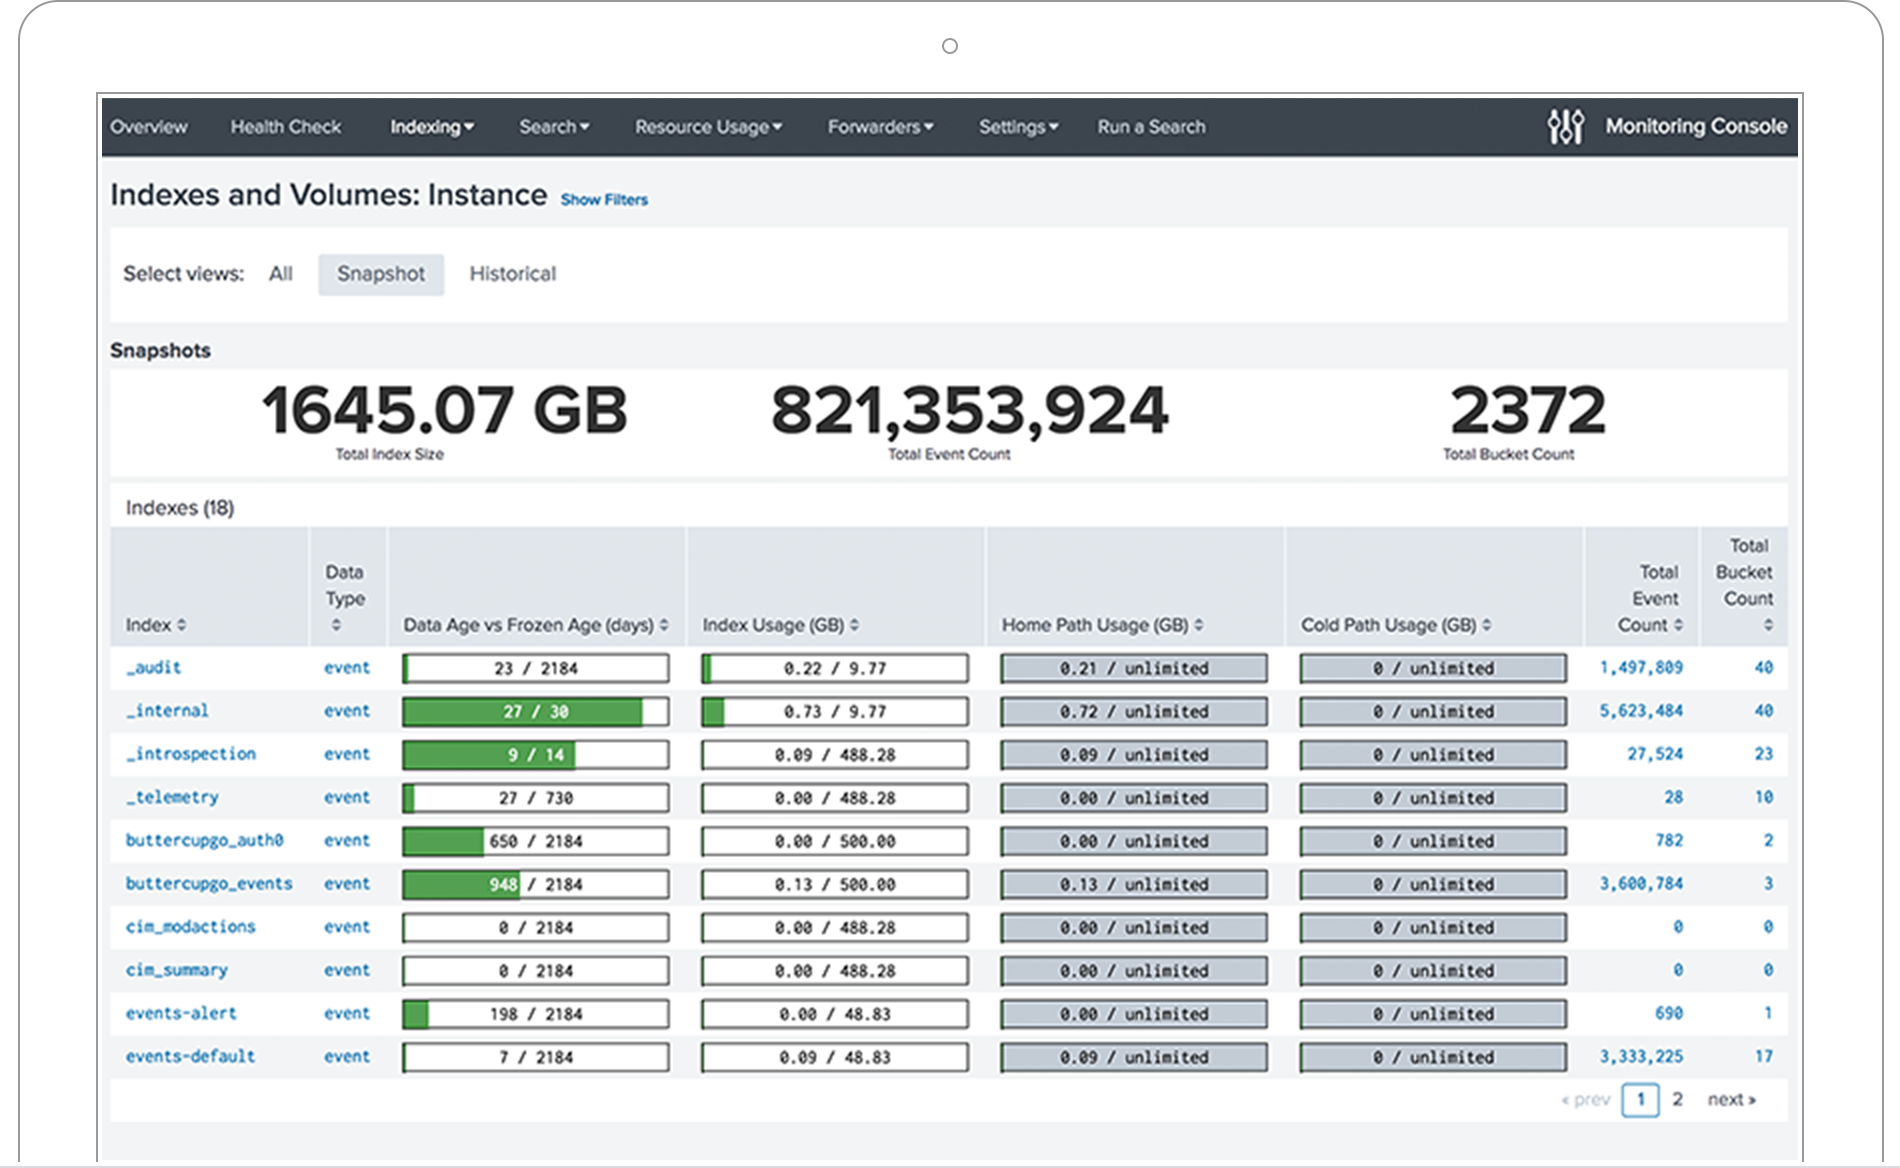
The Splunk Monitoring Console for Splunk Enterprise provides a complete system and feature monitoring interface — including topology views and alerting of system status and health — for all components of on-premises deployments. The console creates a single interface to view the status, performance, capacity and interconnectivity of these components, allowing the admin to optimize their system.

scale-and-manageability

Performance

Continued advancements in Splunk Enterprise speed

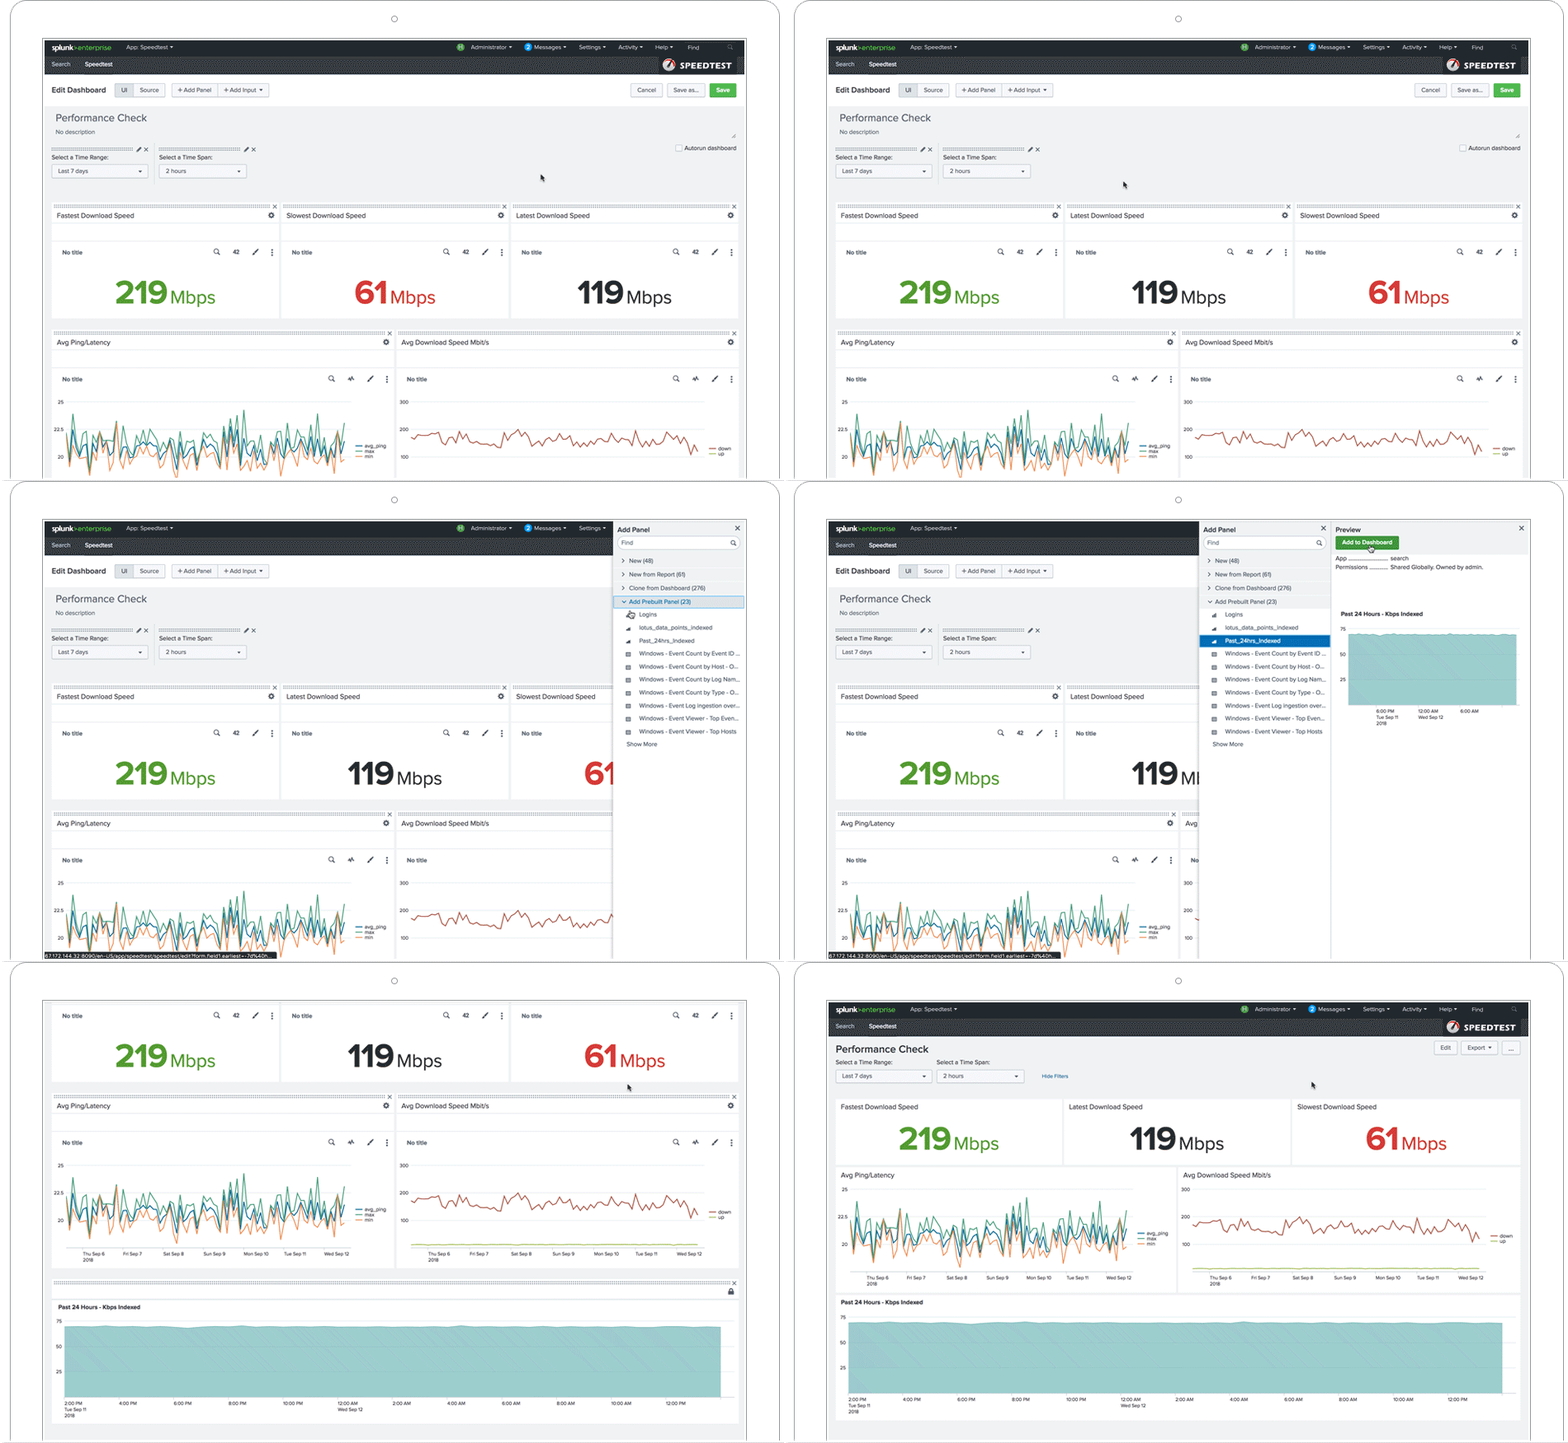
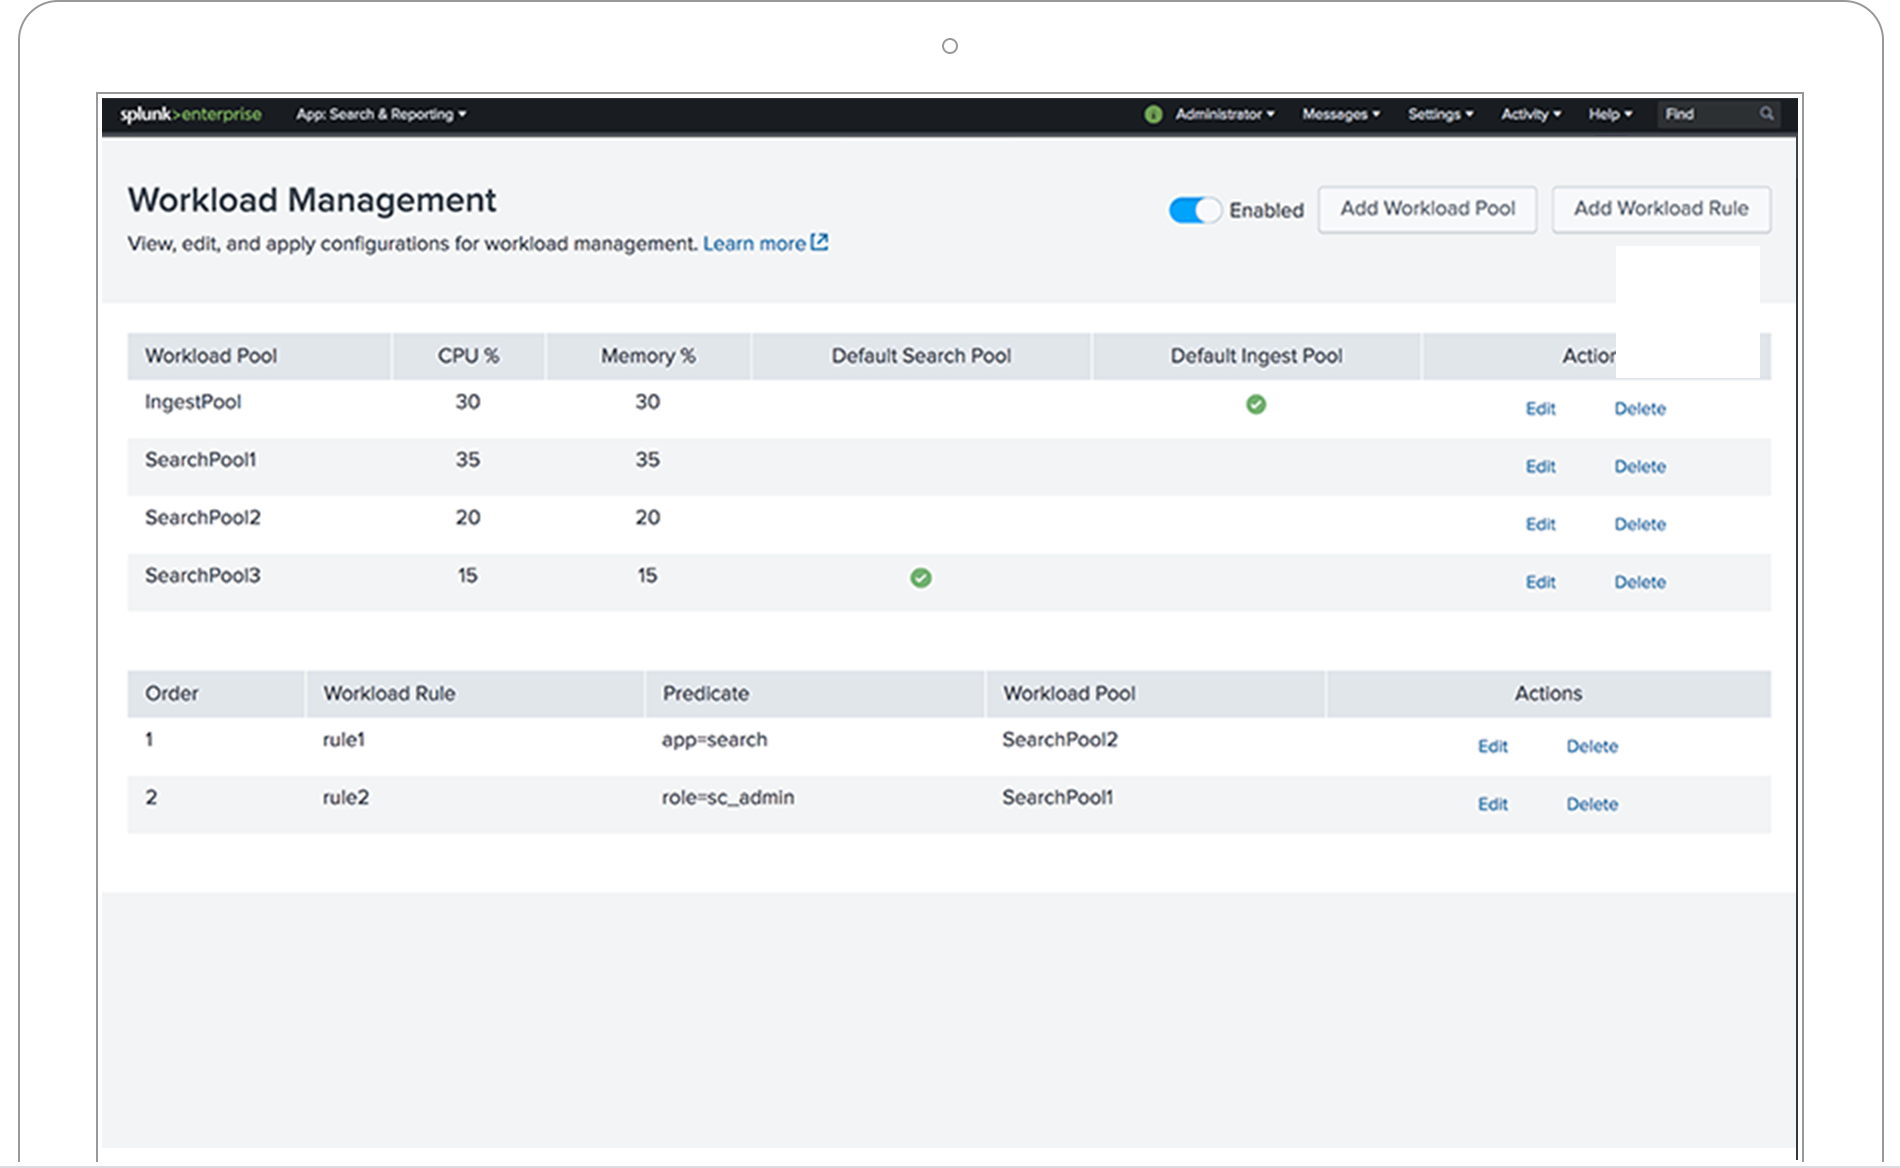
Splunk's Workload Management feature provides a policy-based mechanism that enables you to reserve system resources (e.g. CPU and memory) for ingestion and search workloads based on your organization’s priorities. This enables administrators to classify workloads into different groups and then reserve system resources for higher-priority workload groups.

workload-management

Integrations

Enterprise Integrations

Embed everywhere and bring you workstreams together

Embed Splunk reports in any application or use our ODBC integrations to access Splunk data in applications such as Microsoft Excel or Tableau. And with Splunk alerts, you can automatically trigger actions in ticketing or other task assignment systems. Additionally, rich SDKs let your team integrate Splunk data and functionality in ways we may not have even thought of yet.


User Auth

A secure, transportable identity system

Splunk Enterprise supports SAML integration for single sign-on through most popular identity providers like Okta, PingFederate, Azure AD, CA SiteMinder, OneLogin and Optimal IdM. Splunk Enterprise can also integrate with other authentication systems, including LDAP, Active Directory, and e-Directory.

okta
pingfederate
AzureAD
Onelogin


Storage Optimization

Keep it in Splunk or export it out

Data retention costs are a significant part of your analytics budget, so Splunk Enterprise offers two options to reduce historical data storage costs by up to 80 percent while retaining Splunk search capabilities. Keep historical data within Splunk and reduce the data footprint of seldom-analyzed, cold data or roll your data to an existing Hadoop or Amazon Simple Storage Service (Amazon S3) data lake.

pingfederate
AzureAD


Certifications

Industry certified, customer trusted

ISO 27001, SOC 2 Type 2, GDPR, PCI DSS, HIPAA, FedRAMP, no matter, Splunk is certified with industry bodies to ensure your data's security.


Apps and Add-ons

Splunk app marketplace for more uses

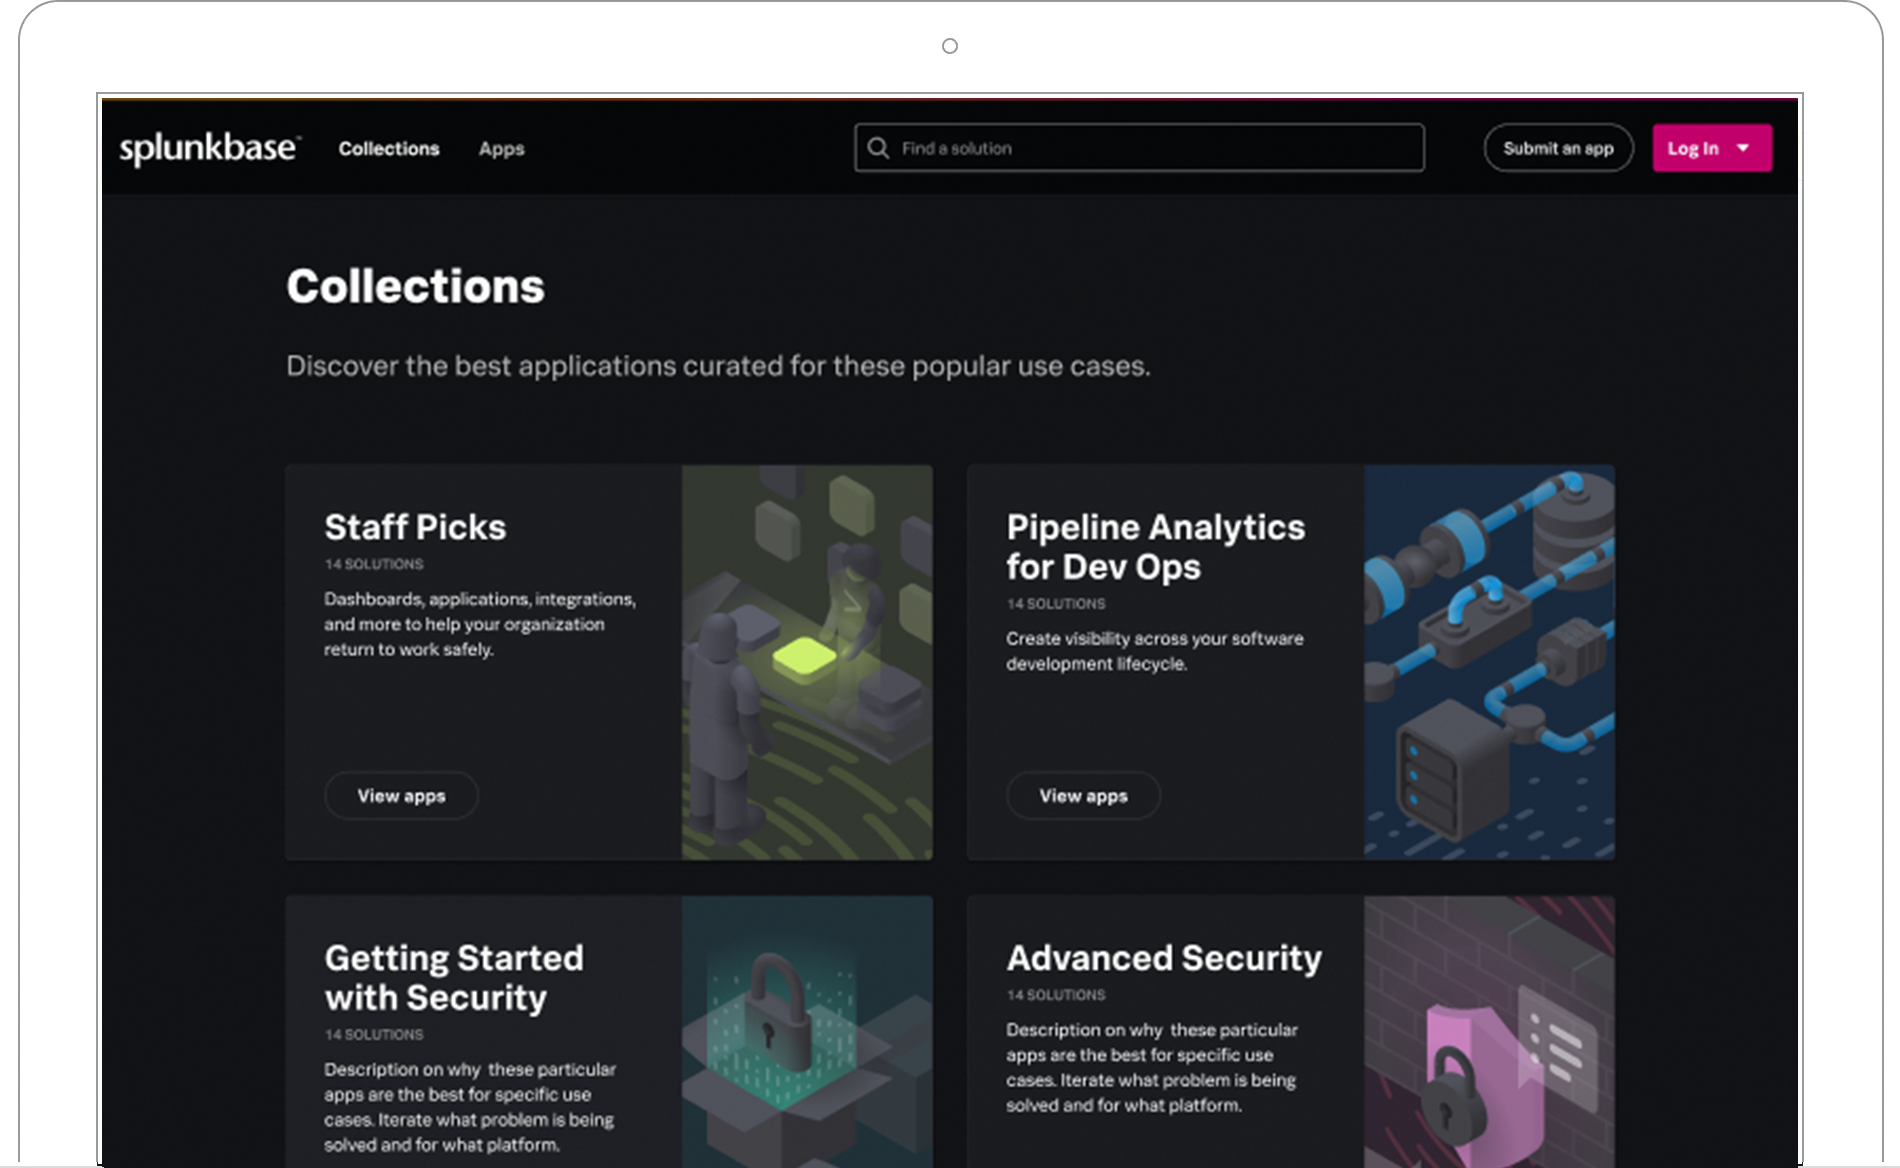
Splunkbase has 1000+ apps and add-ons from Splunk, our partners and our community and most are compatible and vetted for Splunk Enterprise. Find an app or add-on for most any data source and use case. 

apps and add-ons screenshot

Using All Your Data

Ingesting from thousands of data sources and counting

With a variety of standard and custom input methods, Splunk Enterprise can ingest all kinds of data types. File-based data can be sent via forwarders that reside directly on the data sources, while data from DevOps, IoT and other sources can be directly ingested using the Event Collector API. Additionally, common IT, security and application data sources can be onboarded and analyzed directly with hundreds of free apps and add-ons available on Splunkbase.

Splunk Search Processing Language (SPL)

Do you speak our language?

SPL is our secret sauce. This powerful query language is what enables you to investigate your machine data. With support for five different correlation types (i.e. time, transactions, sub-searches, lookups and joins) and over 140 analytical commands, you can conduct deep analysis, use event pattern detection, and apply machine learning methods to predict outcomes and even discover new opportunities in your data.

Splunk Training

Splunk courses designed with your success in mind

Splunk Training is the place for coursework on specific Splunk topics and learning paths to take you from novice to power user. Go from investigative keyword searches to creating rich reports and visualizations from scratch. Learning paths range from topics focusing on end users to those focused on administering Splunk Enterprise, including user provisioning, data source inputs and system configurations.

Support and Services

Don't go at it alone, we can help

Your success is our top priority. Splunk offers a variety of Support and Professional Services options that address your business needs and help you harness the value of Splunk.

professional-services professional-services

Professional Services

From adoption assistance to accelerated onsite implementation, our professional service levels are arranged to get you up and running fast

Splunk Cloud Services
customer-support customer-support

Support

Whether it's guaranteed response times or direct access to Splunk’s Support team for hands-on issue resolution, choose the level of support best suited for your organization

Customer Support
customer-success customer-success

Customer Success

Customer Success brings together Support and Professional Services resources to craft a success plan tailored to your specific business and Splunk configuration

Customer Success

Pricing

Splunk Enterprise offers options by data volume or compute power, allowing you to find the right fit for your needs

With scalable, flexible and predictable pricing options, Splunk can help you bring data to every question, every decision and every action.  

Splunk Enterprise software is priced by your compute capacity or by how much data you send into your Splunk installation in a day. Your compute capacity, measured in vCPUs, is the calculation of CPU resources allocated and available to Splunk for Search Head and Indexer components. Pricing by  compute capacity is a standard, value-oriented way to align your Splunk investment with your search activity, freeing you up to bring in as much data you want.  

If you prefer to price by how much data you send into your Splunk installation in a day, we recommend that you purchase a license size that aligns with the maximum amount of data you expect to send to Splunk in one day. With this pricing model, you pay once to index the data and then can perform unlimited searches against that data, as well as store it for as long as you like.

Licensing

Splunk offers *Term licenses. A Term License is for a specific time period—usually a year—during which you are allowed to access and use Splunk Enterprise.

*As of November 1, 2019, all Splunk products and services feature term licenses. We no longer sell any products with perpetual licenses. For more information click here.

Free Trial
Pricing FAQ

What can you do with Splunk?