
Troubleshoot Kubernetes better
Stop reacting, start diganosing with clarity. Learn to troubleshoot K8s faster with this free guide.

Key takeaways
One of the first things you’ll learn when you start managing application performance in Kubernetes? It’s complicated. No matter how well you’ve mastered performance monitoring for conventional applications, Kubernetes monitoring is a very different technical landscape.
Since Kubernetes environments are dynamic, distributed, and ephemeral, getting the telemetry data you need to monitor successfully is much more challenging.
In this article, we’ll cover everything you need to know about Kubernetes monitoring, including:
Many businesses rely heavily on Kubernetes (K8s) to manage and scale their containerized applications. In fact, 84% of organizations are either evaluating or already using Kubernetes in production.
However, as Kubernetes environments grow, they quickly become complex due to:
These things make it difficult to collect telemetry data from the right sources, get the context needed to diagnose the root cause of issues, and ensure that applications and infrastructure are running smoothly. To address these challenges, organizations implement Kubernetes monitoring solutions.
Implementing Kubernetes monitoring provides visibility into the performance and health of Kubernetes environments by exposing critical telemetry data like metrics, logs, and traces. With insight into key metrics, Kubernetes monitoring can help:
Since most applications are distributed, monitoring becomes necessary for maintaining reliability by helping DevOps teams and system administrators answer questions such as:
When done right, monitoring provides actionable insights to preempt potential bottlenecks and reduce system disruptions, which improves the overall user experience.

There are several types of Kubernetes metrics and each one provides specific insights. So, let’s see what they are:
Cluster metrics help you track the overall health of the Kubernetes cluster. They include information like:
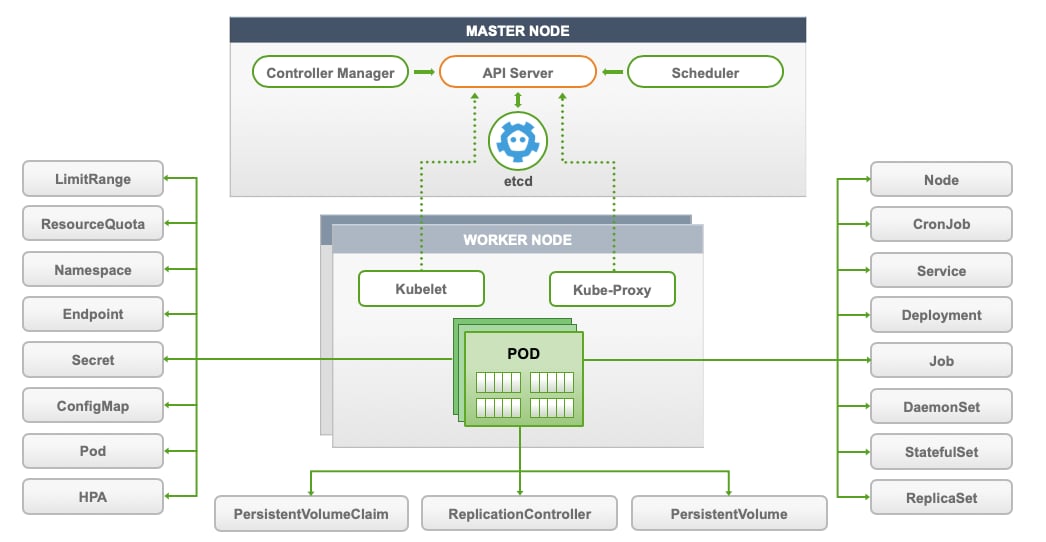
Control plane metrics provide insights into the components responsible for maintaining the desired state of the cluster. For example, monitoring metrics around the scheduler, controller manager, and API server can help detect issues before they impact cluster health and workloads.
(Related reading: control plane vs. data plane.)
Node metrics focus on individual nodes within the cluster. They show how much of a node's resources — such as CPU, memory, network bandwidth, and disk space — are being used.
Pod metrics. Pods are the smallest deployable units in Kubernetes and contain one or more containers. Pod and container metrics include resource usage and pod/container statuses (running, pending, failed, waiting, terminated, etc.) and they identify whether the requested resources are being successfully scheduled.
Workload and application metrics monitor the applications running within your pods. They give insights into app-specific performance indicators, such as:
Kubernetes has become the de facto standard for container orchestration. However, monitoring and observability are two of the biggest challenges in adopting Kubernetes, second only to a lack of training around containerized environments.
In the latest CNCF survey, 46% of those surveyed say this lack of training is a key challenge for organizations beginning their cloud-native journey. Security concerns (40%) and the complexities of monitoring and observability with container proliferation further complicate adoption. But here are the reasons behind these challenges:
To address these challenges, a new approach is required to monitor Kubernetes-based environments effectively. Here’s what it should look like:
(Related reading: Kubernetes logging done right.)
Here are some of the best practices to follow when monitoring Kubernetes:
Not all data is equally useful. Focus specifically on system and application metrics because they directly impact your system's health and performance.
So, align these metrics with your business objectives and define collection rates and retention periods for efficient data management.
(Related reading: SRE metrics to know.)
Use labels (key-value pairs) attached to Kubernetes objects like pods and nodes to organize and manage your resources.
For example, you can label pods by deployment name or environment ('app=web' or 'env=production') for easy filtering and aggregation of metrics. This will simplify both monitoring and troubleshooting since you can focus on specific subsets of your infrastructure.
As your cluster grows, manually configuring monitoring for each new service becomes impractical. Implement service auto-discovery to detect and monitor new services as they are deployed automatically.
Configure alerts to notify you of critical issues, such as high resource usage or application errors. Make sure that alerts are actionable and directed to the appropriate teams for swift resolution. This will prevent minor issues from escalating into major problems.
Monitoring Kubernetes can be challenging — however, the right tools make it easier by helping you track what's happening in your clusters. Let’s look at some of the most common tool options:
Kubernetes Dashboard provides a basic UI for getting resource utilization information, managing applications running in the cluster, and managing the cluster itself.
You can deploy it with Helm using the following commands:
# Add kubernetes-dashboard repositoryhelm repo add kubernetes-dashboard https://kubernetes.github.io/dashboard/# Deploy a Helm Release named "kubernetes-dashboard" using the kubernetes-dashboard charthelm upgrade --install kubernetes-dashboard kubernetes-dashboard/kubernetes-dashboard --create-namespace --namespace kubernetes-dashboard
You must create a secure channel for your Kubernetes cluster to access the Dashboard from your local workstation. To do so, run the following command:
$ kubectl -n kubernetes-dashboard port-forward svc/kubernetes-dashboard-kong-proxy 8443:443

Kubewatch is a simple tool for monitoring your Kubernetes cluster. It sends alerts to platforms like Slack or Microsoft Teams whenever something changes in your cluster, such as updates to pods or services. You can set up these notifications using an easy-to-edit YAML file and get real-time updates about what's happening.
You can set up Kubewatch manually or with Helm charts. Unlike other monitoring tools, it gives fast alerts to keep you in the loop about your cluster's activity.
However, it can also overwhelm you with excessive notifications and users report that it provides no options to customize messages or filter specific event types. This makes it hard to focus on critical actions.
Lastly, and perhaps most importantly, Kubewatch is no longer under active development.
Splunk offers intuitive and comprehensive Kubernetes monitoring, no matter what your needs are. If you're using a cloud provider like AWS or Google, Splunk can connect directly to services like CloudWatch or Stackdriver to collect basic metrics — without requiring an agent.
Successful implementation of Splunk Observability offers many outcomes, including:
Users of Splunk Observability can also opt into Observability Kubernetes Accelerator. This optional accelerator helps you take greater advantage of Splunk Observability and implement data onboarding using the power of OpenTelemetry, greatly improving your team’s visibility into your Kubernetes environment.
(Learn more about monitoring K8s with Splunk.)
You can easily configure Splunk Observability and set up Kubernetes monitoring by deploying the Splunk OpenTelemetry Collector for Kubernetes via Helm. With Helm (3.x) installed, simply run the following commands to send telemetry data from your Kubernetes environment to Splunk Observability Cloud:

Monitoring applications in Kubernetes may seem daunting. But ultimately it’s not so different from application monitoring in other ecosystems. The dynamic, distributed, and ephemeral nature of Kubernetes environments creates unique monitoring challenges. However, with the right monitoring tools, accessing and analyzing the telemetry data you need can help achieve a successful Kubernetes monitoring practice.
See an error or have a suggestion? Please let us know by emailing splunkblogs@cisco.com.
This posting does not necessarily represent Splunk's position, strategies or opinion.


The world’s leading organizations rely on Splunk, a Cisco company, to continuously strengthen digital resilience with our unified security and observability platform, powered by industry-leading AI.
Our customers trust Splunk’s award-winning security and observability solutions to secure and improve the reliability of their complex digital environments, at any scale.

Get the latest articles from Splunk straight to your inbox.
© 2005 - 2025 Splunk LLC All rights reserved.